Role of design in the perception of data visualizations
Theoretical and conceptual basis
DOI:
https://doi.org/10.24310/idiseo.18.2023.17867Keywords:
visual communication, information design, graphical elements, colorAbstract
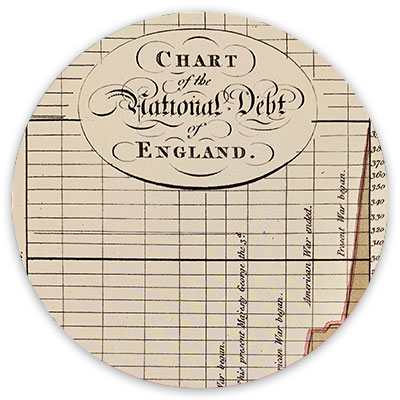
Our current context uses visual elements more and more frequently. In parallel, information design and data visualizations have been developed to enable people to perceive and understand complex content. However, graphic design is often not seen as a necessary discipline to make the communication process more effective, on the other hand, it is perceived as useful to ornament the visualization, without considering that design tools and processes can improve the perception process of data visualizations. In this article, a brief theoretical review is made and research that link the role of graphic design with the process of perception of data visualizations are analyzed, as well as the importance of elements such as color to achieve a more direct and efficient communication.
Downloads
Metrics
Publication Facts
Reviewer profiles N/A
Author statements
Indexed in
-
—
- Academic society
- N/A
- Publisher
- Universidad de Málaga
References
ARRAIGADA, Jaime (2018). Florence Nightingale con el Gráfico de la Rosa, Revista Médica Clínica Las Condes, 29(3), 380-382. https://doi.org/10.1016/j.rmclc.2018.05.003
BERTIN, Jacques (1967). Sémiologie graphique. Les diagrammes, les réseaux, les cartes, Gauthiervillars/ Mouton, París.
CAIRO, A. (2013). The functional art. An introduction to information graphics and visualization, New Riders (Pearson), California.
_____ (2016). The truthful art. Data, charts, and maps for communication, New Riders (Pearson), California.
CLEVELAND, William y McGill, Robert (1984). Graphical Perception: Theory, Experimentation, and Application to the Development of Graphical Methods, Journal of the American Statistical Association, 79(387), 531-554. https://doi.org/10.2307/2288400
HELLER, E. (2010). Psicología del color. Cómo actúan los colores sobre los sentimientos y la razón, Editorial Gustavo Gili, Barcelona.
MEIRELLES, Isabel (2014). La información en el diseño, Parramón Arts & Design, Barcelona.
MODESTOW, Kirsten (2020, 3, 19). Pandemics and Pantones: The Role of Color in Clear Communication, https://thedieline.com/blog/2020/3/30/pandemics-and-pantones-the-roleof-color-in-clear-communication?
RENDGEN, Sandra (2019). History of information graphics, Taschen, Colonia.
TUFTE, Edward R. (2018 [s.e.]). The Visual Display of Quantitative Information, Graphics Press LLC, Connecticut.
WEXLER, S., Shaffer, J., y Cotgreave, A. (2017). The Big Book of Dashboards. Visualizing your Data Using Real-World Business Scenarios, Wiley, Nueva Jersey.

Downloads
Published
How to Cite
Issue
Section
License
Copyright (c) 2023 Mariana Guerrero del Cueto

This work is licensed under a Creative Commons Attribution-NonCommercial-NoDerivatives 4.0 International License.
Aquellos autores/as que tengan publicaciones con esta revista, aceptan los términos siguientes:- Los autores/as conservarán sus derechos de autor y garantizarán a la revista el derecho de primera publicación de su obra, el cuál estará simultáneamente sujeto a la Licencia de reconocimiento de Creative Commons que permite a terceros compartir la obra siempre que se indique su autor y su primera publicación esta revista.
- Los autores/as podrán adoptar otros acuerdos de licencia no exclusiva de distribución de la versión de la obra publicada (p. ej.: depositarla en un archivo telemático institucional o publicarla en un volumen monográfico) siempre que se indique la publicación inicial en esta revista.
- Se permite y recomienda a los autores/as difundir su obra a través de Internet (p. ej.: en archivos telemáticos institucionales o en su página web) antes y durante el proceso de envío, lo cual puede producir intercambios interesantes y aumentar las citas de la obra publicada. (Véase El efecto del acceso abierto).


14.png)


