Relación
entre conexión con la naturaleza y creencias ambientales
Relationship
between connectedness with nature and environmental beliefs
Antonio
Matas Terrón
Universidad
de Málaga, España (amatas@uma.es)
Recibido
el 7 de febrero de 2018; revisado el 14 de noviembre de 2018;
aceptado el 3 de abril de 2019; publicado el 1 de diciembre de 2019
RESUMEN:
La
conectividad con la naturaleza se define como un sentimiento de
pertenencia al medio natural. Estudios sobre la relación entre
conectividad y las creencias ambientales de la escala del nuevo
paradigma ambiental muestran valores medios-bajos de correlación.
El objetivo de esta investigación es comprobar si los niveles de
relación son estructurales o se deben a un sesgo metodológico. Ha
participado una muestra incidental de 459 universitarios. A nivel
metodológico, se han estimado los niveles de conectividad y
creencias ambientales a través de la Teoría de Respuesta al Ítem.
Para ello se ha utilizado la librería “ltm” del programa R.
Posteriormente se han correlacionado las estimaciones. Los
resultados muestran valores medios de relación entre ambas
variables. Este resultado, junto con los revisados en la literatura,
sugiere que esta relación es estructural y no resultado de la
metodología utilizada. Finalmente, se discute sobre las
implicaciones educativas de estos resultados.
PALABRAS
CLAVE: EDUCACIÓN, MEDIO AMBIENTE, TEORÍA DE RESPUESTA AL ÍTEM.
ABSTRACT:
Connectedness
with nature is defined as a feeling of belonging to the natural
environment. Studies on the relationship between connectedness and
environmental beliefs from the New Environmental Paradigm Scale show
medium-low correlation values. The aim of this research is to test
whether the correlation levels are structural or due to a
methodological bias. An indicental sample of 459 university students
has been involved. At the methodological level, the levels of
connectedness and environmental beliefs have been estimated through
the Item Response Theory. For this, the R Package ‘ltm’ has been
used. Subsequently, the estimates values have been correlated. The
results show average relationship values between both variables.
This result, together with those reviewed in the literature,
suggests that the relationship is structural, and not the result of
the methodology used. Finally, the educational implications are
discussed.
KEYWORDS:
EDUCATION, ENVIRONMENT, ITEM RESPONSE THEORY.
1Introducción
The concept of connectedness to nature was proposed by Schultz
(2001) with the target to represent the way in which people take in
the environment as a part of the cognitive representations of
themselves.
Researchers such as Mayer and Frantz (2004) have highlighted the
emotional character of this construct, arguing that people who are
really engaged with the environment need to feel themselves as a
part of nature. Initially, the Inclusion of Nature in Self (INS)
Scale was proposed in order to measure the connectedness (Schultz,
2002). Later, Schultz, Shriver, Tabanico, and Khazian (2004)
implemented the INS scale in a test of implicit association.
Mayer and Frantz (2004) developed the Connectedness with Nature
Scale (CNS) in order to measure the different affective aspects of
belonging to nature. This scale has been criticised regarding its
validity. In this sense, Perri and Benassi (2009) suggest scale
could be measured instead of emotional factors. These critics could
be related with the verb “to feel”, and its ambiguous meaning
(to perceive and to experience an emotion). This problem disappears
when the scale is adapted into Spanish language (see authors, 2012).
Mayer and Frantz (opus cit.) administered the CNS and the New
Environmental Paradigm Scale (Dunlap y Van Liere, 1978) at the same
time to the same sample of people in order to analyse the CNS's
psychometric properties.
The New Environmental Paradigm Scale (NEP) measures the primitive
environmental beliefs. It has been used widely to measure beliefs,
values and attitudes, although its ambiguity to measure these
constructs has been noticed, as well as lack of relation with the
theoretical psychosocial structure of the attitudes (Vozmediano y
San Juan, 2005).
This lack of relation could happen because primitive beliefs and its
influence onto observed behaviour are mediated through a high number
of variables (Gardner y Stern, 1996).
Another question is the scale's dimensionality. Although scale's
authors found validity indications (Dulanp, Van Liere, Merting y
Jones, 2000) there is not an agreement about if the scale is
unidimensional or multidimensional (Cordano, Welcomer y Scherer,
2003).
On the other hand, Mayer and Frantz (opus cit.) hypothesized that
the correlation between connectedness scale and new paradigm scale
would be moderated, because every factor measures different
constructs. Their results were supporting this hypothesis (r=0.35;
p<.01; n=62). However, other researchers, such as Perrin and
Benssi (opus cit.) have found higher correlations (r=.45; p<.01;
n=56).
So far, the researches reviewed and exposed were developed with
correlational methodology from direct data from surveys. The
question is if a different system of estimating the constructs,
instead of using direct responses to items, could shed light on the
matter.
Then, the aim of this study is to estimate the levels from sample
for every factor from the scales through the Item Theory Response,
and then analyse the correlations between the estimated factors of
the two scales. The final aim will be knowing if the correlations
will be moderate/medium (as Mayer and Frantz predict) or higher (as
Perrin and Benassi found) or any other case.
2mEthod
2.1Participants
Participants were
459 Spanish speakers. Demographic characteristics are summarized in
table 1. Mean of the age was 21.31 (s.d.=5.073), with 76% of female.
About economic average, 81.5% had median level, 16% low level, and
2.5% high level.
Table 1. Distribution of the
sample by origin
|
University
|
Percentage%
|
|
University of Sevilla
|
41.66%
|
|
University of Almería
|
23.23%
|
|
Other Andalusian Universities
|
23.66%
|
|
Universities of Perú
|
10.30%
|
|
Without information
|
1.15%
|
|
University of Sevilla
|
41.66%
|
Chi-square statistic proof was conducted in order to identify
differences between groups from different universities (gender, age
and economic level). No significative differences were found except
in age of whole Spanish group and the Peruvian group
(Chi-square=238,573; f.g.=27; p<0,001). Mean age in Spanish group
was 21.67 (s.d.=5.167) while of the Peruvian group age was 18.46
(s.d.=3.045).
2.2Procedure
A survey design was conducted in order to reach the aim. A
questionnaire was developed with Google Docs application in order to
get the data through internet.
The Google Docs application form only were available on days, and
hours indicated by the collaborator teachers from universities.
Then, not controlled access to the form was avoided. Data were
obtained during January and February 2011.
2.3Instruments
The questionnaire included a Spanish version of CNS Scale by Mayer
and Frantz (2004) in order to study connectedness, plus a NPA scale
version by Vozmediando and San Juan (2005) in order to get data
about beliefs.
CNS Spanish version scale has fourteen items, with five points of
answers between 1 (very desagreement) to 5 (very agreement).
In another research with a universitary Spaniard sample (Authors,
2012), the scale obtained a Cronbach's alpha of .71, with four
latent components (50% of explained variance).
2.4Analyses
Data from items 4, 12 and 14 from connectedness scale, were inverted
because their meaning is inverse, as authors mentioned (Mayer and
Frantz opus cit.). Then, a Component Analyses was conducted in order
to know the dimensionality of the scales.
The objective was to conduct the Item Response Theory with
unidimensional groups of item, for facilitating interpretation from
models.
The next step was the dichotomization of scores in order to conduct
the Item Response Theory analyses. Some doubts may appear during the
process of dichotomization of scales in impair responses regarding
intermediate scores (neutral position or indecise position)
A priori, it could be recategorized as 0 point or as 1 point. In
this case, the position from authors was mainly conservative, with
the intention of clearly establishing the differences between
proenvironmental profiles. So, option 3 or less points in the scale
was recategorized as 0 and above as 1.
The trait latent models were developed with the variables selected
from every scale. The
model with the best good-fitting was selected. Then levels of
connectedness and beliefs of the sample were estimated.
A correlation analysis between connectedness and beliefs was
conducted for each participants from the sample.
In this analyses the use of IRT is highlighted as an alternative to
other statistical processes based on direct estimation from
factorial structures.
The IRT is an area of development in Psychometry. This statistical
strategy assumes that there is a link between a person's latent
trait and his or her response. This link, that can be expressed in
terms of probability, is represented with the item curve
characteristic (ICC). The latent trait models basic assumptions are:
Latent
trait: the main assumption is there isn't an observed variable, but
latent, that explains the responses from one person to an item.
Unidimensionality:
that is the item or the instrument measures only one trait.
Local
independence: that is, the response to an item is independent from
other responses to other items. Then, the probability of obtaining
correct responses in a set of items is equal to the product of the
probabilities of every item that is correctly answered.
Some times, it is difficult to check the items local independence.
It's usually to check the unidimensionality only with a factorial
analysis, or with another similar statistic analysis.
Taking in account the number of parameters to estimate, three
different models are distinguished in IRT:
One-parameter
model: It's named the Rasch's model. This model estimates one
parameter only, the item difficult (b).
Two-parameter
model: It estimates the item difficult (b) and its discrimination
(a).
Three-parameter
model: it's known as Birnbaum's model. Although it is included as
part of IRT models, it may be considered as an alternative
statistic technique in order to analyse tests. This model analyses
the item difficult, the discrimination item and the chance to guess
the correct answer to one item. It's the pseudo-azar parameter to
overcome the item (c).
The phases to develop in order to analyse one test with IRT, and to
estimate the trait levels from the test answers, are below:
Arrange the
data for analysis.
Evaluate
that the assumptions of IRT are satisfied.
Estimate the
parameters of the selected model (one, two or three parameters) as
well as the information levels. Elaborate the summaries and the
graphics.
Analyse the
model fit to data. If the fit is not good, return to previous phase
using another model.
Estimate
skill levels from participants.
In order to analyse data, the SPSS package statistical analyses
version 19 (2010) was used, as well as R program (R Development Core
Team, 2011) specifically its ltm package (Rizopoulos, 2006).
3Resultados
Connectedness with Nature Scale (CNS)
A principal components analysis (PCA) was conducted on the scale to
investigate the factor structure of the instrument. Firstly, the
model assumptions were examined. The Keiser-Meyer-Olkin measure of
sampling adequacy was acceptable, .882, and Bartlett's test of
sphericity was significant, p<.0001 (Chi-square= 1410.503; fd=
91). This suggests that PCA is appropriate for these data. Results
suggested that an one-component solution was the best. The signal
factor explained 30.85% of the variance after extraction (table 2).
Table 2. Principal components
from CNS
|
|
Comp.
1
|
Comp.
2
|
Comp.
3
|
|
c11
|
0.795
|
|
|
|
c9
|
0.689
|
|
|
|
c2
|
0.663
|
|
|
|
c10
|
0.662
|
|
|
|
c6
|
0.635
|
|
|
|
c8
|
0.629
|
|
|
|
c5
|
0.607
|
|
|
|
c7
|
0.595
|
-0.345
|
|
|
c1
|
0.563
|
|
0.241
|
|
c3
|
0.531
|
|
|
|
c12
|
-0.210
|
0.770
|
0.286
|
Although one component solution was efficient for whole items in the
scale, in order to develop the IRT analyse only the items that
charged in this component were used. Then, the unidimensionality was
guaranteed (ítems c1, c2, c3, c5, c6, c7, c8, c9, c10 and c11).
Thereafter, the dichotomization of scores were done according the
criterion exposed before (options 1, 2 and 3 were changed by 0, and
options 4 and 5 by 1).
A Chi-squared test of association between pairs was developed. Given
that the IRT analyse assumes that relations between items can be
explained by the latent variables, if there is not relation found
can indicate that this assumption is not satisfied. All association
tests were not significants.
The one-parameter model was evaluated (Rasch's model) (annex III).
The Bootstrap fitted likelihood test showed a non-significant value
(p=.2) using Chi-square test. This suggests an acceptable fit
between model and data. Nevertheless, a marginal residuals proof was
conducted using the 3.5 value rule and numerous problems of
adjustment between pairs of items were observed (annex IV).
The two-parameter model was conducted (annex V). The results showed
an acceptable level of fit (annex VI). And the three-paramater model
was conducted too, obtaining similar results (annex VII and annex
VIII).
Between every pair of models an ANOVA test was conducted. The global
results suggested to select the two-parameter model in order to
estimate the parameter from data (table 3).
Table 3. Anova between IRT
models of conectedeness
|
anova(mod_1.mod_3)
|
|
|
Likelihood
Ratio Table
|
|
|
AIC
|
BIC
|
log.Lik
|
LRT
|
df
|
p.value
|
|
mod_1
|
5227.23
|
5268.52
|
-2603.62
|
|
|
|
|
mod_2
|
5135.70
|
5218.28
|
-2547.85
|
111.53
|
10
|
<0.001
|
|
anova(mod_1.mod_4)
|
|
|
Likelihood
Ratio Table
|
|
|
AIC
|
BIC
|
log.Lik
|
LRT
|
df
|
p.value
|
|
mod_1
|
5227.23
|
5268.52
|
-2603.62
|
|
|
|
|
mod_3
|
5153.52
|
5240.23
|
-2555.76
|
95.72
|
11
|
<0.001
|
|
anova(mod_3.mod_4)
|
|
|
Likelihood
Ratio Table
|
|
|
AIC
|
BIC
|
log.Lik
|
LRT
|
df
|
p.value
|
|
mod_2
|
5135.70
|
5218.28
|
-2547.85
|
|
|
|
|
mod_3
|
5153.52
|
5240.23
|
-2555.76
|
-15.82
|
1
|
1
|
Note:
mod_1= Rasch model; mod_2= Two parameters model; mod_3: Three
parameters model
The information level between -4 to 4 connectedness score was 16.29
(Cronbach alpha= .791). The item characteristic curves and the
information curves are exposed in graph 1.
Graph 1.
Characteristic curves of the items from the two parameters model of
the Connectedness scale
Table 4. Two parameters model
from connectedness items
|
|
value
|
std.err
|
z.vals
|
|
Dificulty c1
|
-0.0407
|
0.0966
|
-0.4208
|
|
Dificulty c2
|
-1.0411
|
0.1148
|
-9.0695
|
|
Dificulty c3
|
-2.1831
|
0.3449
|
-6.3301
|
|
Dificulty c5
|
-0.0226
|
0.0967
|
-0.2339
|
|
Dificulty c6
|
-0.0892
|
0.1007
|
-0.8858
|
|
Dificulty c7
|
0.3727
|
0.0896
|
4.1575
|
|
Dificulty c8
|
0.2536
|
0.0941
|
2.6940
|
|
Dificulty c9
|
-0.1623
|
0.0853
|
-1.9038
|
|
Dificulty c10
|
-0.1290
|
0.0789
|
-1.6354
|
|
Dificulty c11
|
-0.2994
|
0.0684
|
-4.3788
|
|
Discrimination c1
|
1.2689
|
0.1718
|
7.3860
|
|
Discrimination c2
|
1.8272
|
0.2609
|
7.0033
|
|
Discrimination c3
|
1.0147
|
0.1968
|
5.1565
|
|
Discrimination c5
|
1.2665
|
0.1708
|
7.4138
|
|
Discrimination c6
|
1.1927
|
0.1644
|
7.2528
|
|
Discrimination c7
|
1.6115
|
0.2133
|
7.5546
|
|
Discrimination c8
|
1.3927
|
0.1863
|
7.4757
|
|
Discrimination c9
|
1.6219
|
0.2092
|
7.7537
|
|
Discrimination c10
|
1.8941
|
0.2436
|
7.7749
|
|
Discrimination c11
|
3.2001
|
0.4988
|
6.4152
|
New Environmental Paradigm Scale (NEP)
Initially, a principal components analyses with varimax rotation was
conducted in order to explore the latent structure from the data
(KMO= .797; Chi-square= 1558.255; f.d.= 120; p<.0001) (table 5).
Table 5. Principal
components of the NPA Scale
|
|
Comp. 1
|
Comp. 2
|
Comp. 3
|
|
n9
|
0.719
|
|
|
|
n11
|
0.682
|
|
|
|
n10
|
0.664
|
|
|
|
n7
|
0.575
|
|
|
|
n4
|
|
0.709
|
|
|
n3
|
|
0.707
|
|
|
n2
|
|
0.664
|
|
|
n1
|
|
0.601
|
|
|
n6
|
|
|
0.759
|
|
n5
|
|
0.417
|
0.715
|
|
n8
|
|
|
-0.556
|
|
n12
|
|
|
|
|
n13
|
|
|
|
|
n15
|
|
|
|
|
n16
|
|
|
|
|
n14
|
|
|
|
|
% Var. Explained
|
22.935%
|
14.790%
|
7.683%
|
The analyses suggests there are 5 components (58.64% of variance).
The IRT analyse was developed with variables that charged in the
first components from NEP (variables n7, n9, n10 and n11). The
scores were dichotomised as the previouse case (1, 2 and 3 as 0
score, and 4 and 5 options as 1 score).
All the inter-pairs association Chi-square analyses were
significant. The Bootstrap fit check showed a lack of fitting
(p-value= .005) of the one-parameter Rasch model (annex IX). This
lack of fitting was observed in the residuals analyses too (annex
X).
The two-parameters and three-parameters models were developed (annex
XI and XII). They had similar fits (annex XIII and annex XIV). An
ANOVA analyses was developed with the three models in order to
identify significant differences (table 6).
Table 6. Anova between IRT
models of NPA Scale
|
anova(mod_1.mod_3)
|
|
|
Likelihood
Ratio Table
|
|
|
AIC
|
BIC
|
log.Lik
|
LRT
|
df
|
p.value
|
|
mod_1
|
1734.37
|
1750.89
|
-863.19
|
|
|
|
|
mod_2
|
1684.47
|
1717.51
|
-834.24
|
57.9
|
4
|
<0.001
|
|
anova(mod_1.mod_4)
|
|
|
Likelihood
Ratio Table
|
|
|
AIC
|
BIC
|
log.Lik
|
LRT
|
df
|
p.value
|
|
mod_1
|
1734.37
|
1750.89
|
-863.19
|
|
|
|
|
mod_3
|
1688.56
|
1725.72
|
-835.28
|
55.82
|
5
|
<0.001
|
|
anova(mod_3.mod_4)
|
|
|
Likelihood
Ratio Table
|
|
|
AIC
|
BIC
|
log.Lik
|
LRT
|
df
|
p.value
|
|
mod_2
|
1684.47
|
1717.51
|
-834.24
|
|
|
|
|
mod_3
|
1688.56
|
1725.72
|
-835.28
|
-2.08
|
1
|
1
|
Note:
mod_1= Rasch model; mod_2= Two parameters model; mod_3: Three
parameters model
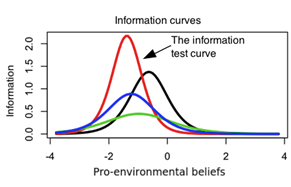
The total information level from variable in the analyses variable
was 8.52 score (Cronbach's alpha= .653). The graphic 2 shows the
information level and the characteristics curves from items.
Table 7. The coeficients of
the two parameters model from the first component items in the NPA
scale
|
|
value
|
std.err
|
z.vals
|
|
Dificulty n7
|
-0.6338
|
0.0895
|
-7.0837
|
|
Dificulty n9
|
-1.3843
|
0.1281
|
-10.8033
|
|
Dificulty n10
|
-0.9762
|
0.1449
|
-6.7363
|
|
Dificulty n11
|
-1.2387
|
0.1415
|
-8.7541
|
|
Discrimination n7
|
2.3455
|
0.4926
|
4.7616
|
|
Discrimination n9
|
2.9500
|
0.7027
|
4.1983
|
|
Discrimination n10
|
1.3368
|
0.2355
|
5.6762
|
|
Discrimination n11
|
1.8848
|
0.3506
|
5.3765
|
Correlations between estimations for the first components from CNS
and NEP
The correlation between first components estimated with IRT from the
two scales was developed (R=.274; p=.01). The correlation power
between both estimations was .999 (s.l.: .05) with a medium effect
size (Cohen, 1988).
Graph 2. Characteristic
curves of the items from the two parameters model of the NPA scale
4Discusión y Conclusiones
Regarding instruments used, the connectedness scale shows a
three-dimensional structure. The first component highlights over the
others. The first can be associated to the mood of being “connected
to environment”. The second and third components can be linked to
concept of “self-location in the environment” and the concept of
“disconnected with nature” respectively.
About the New Environmental Paradigm scale, the structure is a
little bit complex. The first component regard the pro-environment
perspective items, plus items about
environmental degradation. The second component can be interpreted
as the believe in the human capacity for controlling the
environment. The third component would be linked to the people
rights against nature (avoiding to use the expression humankind
rights). The both last components can be linked to the conviction of
limit from natural resources and the trust in the human to fix
negative effects in the environment. Meanwhile the pro-environment
beliefs internal consistent was a little bit lower.
On the other hand, the Pearson correlation between the connectedness
estimation and pro-environment beliefs is low too (table 8). The
size effect can be considered medium (Cohen, 1988). These results in
whole, suggest the beliefs and the experience of being connected
with nature are two realities linked but mediated by others factors.
Regarding the study aim, the results highlight the low relations
between connectedness and primitive beliefs it is not by a
methodological reason. Outcomes from IRT analysis under the light of
outcomes from researches reviewed in the literature (Mayer y Frantz,
2004; Perrin y Bennassi, 2009; Gosling y Williams, 2010) support the
hypothesis that the low relation between both, beliefs and
connectedness, is an structural reality, and it is not a results
from the methodological context in the studies.
Several classical theoretical perspectives, such as the cognitive
dissonance (Festinger, 1957), the theory of reasoned action (Azjen
and Fishbein, 1980), or even the rational emotive therapy (Ellis and
Bernard, 2006), among others, highlighted the relation that have
been found here. So, because the same phenomenon is highlighted from
a diversity of theories, but none of them offers a satisfying
explication, is necessary to develop new studies about the link of
the pro-environment beliefs and the connectedness with nature.
This kind of studies are important because this relation could be
linked with the display of several environmentally responsible
behaviours.
This circumstance was already suggested by Mayer and Frantz (2004),
however they focused on every factor independently, beliefs and
behaviour in one side, and the connectedness in other side.
Continuing with this line of argument, the lack of correlation
between beliefs and connectedness with nature suggests that the
educational environmental programs and the pro-environmental media
campaign must be designed taking in account that emotional factor,
behavioural factor, and cognitive factor must be developed at the
same time. Only then, it is possible to have warranties the three
components of any educational intervention in environmental
education, and in environmental psychology, are developed.
In sum, the results from this study and others from consulted
literature, support the pro-environmental educational programs need
to include elements in order to develop the emotional dimension, the
cognitive dimension and behavioural dimension. It is because there
is not warranty of a complete development of all dimensions in the
person if the program is focused only in two or one of them, taking
into account the lack of relation between environmental beliefs
(cognitive dimension) and connectedness with nature (emotional and
volitive dimension).
It must be highlighted that the sample is incidental. Then, the
conclusions must be taken into consideration with some caution.
Although, in the studies reviewed usually use samples of college
students, another studies with representative samples must be
encouraged. Results from them will illuminate the knowledge about
the relation between beliefs, the connectedness perception and the
responsible behaviours, and about some implications in environmental
education.
5Referencias
Ajzen, I.,
& Fishbein, M. (1980). Understanding
attitudes and predicting social behavior.
Englewood Cliffs, NJ: Prentice-Hall.
Cohen, J.
(1988). Statistical power analysis for
the behavioral sciences. Hillsdale,
New Jersey: Routledge Academic.
Cordano,
M., Welcomer, S.A., & Scherer, R.F. (2003). An analysis of the
Predictive Validity of the New Ecological Paradigm Scale. The
Journal of Environmental Education, 34(3),
22-28.
Dunlap,
R. E., Van Liere K. D., Mertig, A. G. & Jones, R. E. (2000).
Measuring endorsement of the New Ecological Paradigm: A revised NEP
scale.
Journal of Social Issues, 56
(3), 425-442.
Dunlap,
R.E., & Van Liere, K.D. (1978). The new environmental paradigm.
Journal of
Environmental Education, 9,
10-19.
Ellis, A.,
& Bernard, M. E. (2006). Rational
emotive behavioral approaches to childhood disorders: theory,
practice and research. Birkhäuser:
New York.
Festinger,
L. (1957). A theory of cognitive
dissonance. Stanford, CA: Stanford
University Press.
Gosling,
E., & Williams, K. J. (2010). Connectedness to nature, place
attachment and conservation behaviour: Testing connectedness theory
among farmers. Journal of Environmental
Psychology, 30(3),
298-304. doi:10.1016/j.jenvp.2010.01.005
Gardner, G.
T., & Stern, P. C. (1996). Environmental problems and human
behavior. Boston: Allyn and Bacon.
Authors (2012).
Mayer,
F.S., & Frantz, C.M. (2004). The connectedness to nature scale:
A measure of individuals' feeling in community with nature. Journal
of Environmental Psychology, 24,
503-515.
Perrin,
J.L., & Benassi, V.A. (2009). The connectedness to nature scale:
A measure of emotional connection to nature? Journal
of Environmental Psychology, 29,
434-440.
R
Development Core Team (2011). R: A language and environment for
statistical computing. R Foundation for Statistical Computing,
Vienna, Austria. ISBN 3-900051-07-0, URL http://www.R-project.org/.
Rizopoulos,
D. (2006). ltm: An R package for latent variables modelin and item
reponse theory analysis. Journal of
Statistical Software, 17(5), 1-25.
Schultz,
P.W. (2001). The structure of environmental concern: Concern for
self, other people, and the biosphere. Journal
of Experimental Psychology, 21(4),
327-329.
Schultz,
P.W. (2002). Inclusion with nature: The psychology of human-nature
relations. En Schmuck, P., & Schultz, P.W. (Eds.), Psychology
of Sustainable Development (pp.
61-78). Dordrecht: Kluwer Academic Publishers.
Schultz,
P.W., Shriver, C., Tabanico, J., & Khazian, A. (2004). Implicit
connections with nature. Journal of
Environmental Psychology, 24, 31-42.
SPSS para Mac, Rel. 19.0.0.
2010. Chicago: SPSS Inc.
Vozmediano,
L., & San Juan, C. (2005). Escala "Nuevo Paradigma
Ecológico": propiedades psicométricas con una muestra
española obtenida a través de Internet. Medio
Ambiente y Comportamiento Humano, 6(1),
37-49.
Annexes
Annex I
Escala del Nuevo Paradigma Ecológico. Versión de
16 ítems de Vozmediano y San Juan (2005)
n1.- La idea de que la humanidad va a enfrentarse
a una crisis ecológica global se ha exagerado enormemente
n2.- El equilibrio de la naturaleza es lo bastante
fuerte para hacer frente al impacto que los países industrializados
le causan
n3.- Con el tiempo, los seres humanos podrán
aprender lo suficiente sobre el modo como funciona la naturaleza para
ser capaces de controlarla
n4.- El ingenio humano asegurará que no hagamos de la tierra un
lugar inhabitable
n5.- Los seres humanos fueron creados para dominar
al resto de la naturaleza
n6.- Los seres humanos tienen derecho a modificar
el medio ambiente para adaptarlo a sus necesidades
n7.- Cuando los seres humanos interfieren en la
naturaleza, a menudo las consecuencias son desastrosas
n8.- Las plantas y los animales tienen tanto
derecho como los seres humanos a existir
n9.- Los seres humanos están abusando seriamente
del medio ambiente
n10.- El equilibrio de la naturaleza es muy delicado y fácilmente
alterable
n11.- Si las cosas continúan como hasta ahora, pronto
experimentaremos una gran catástrofe ecológica
n12.- Nos estamos aproximando al número límite
de personas que la tierra puede albergar
n13.- La tierra es como una nave espacial, con
recursos y espacio limitados
n14.- A pesar de nuestras habilidades especiales,
los seres humanos todavía estamos sujetos a las leyes de la
naturaleza
n15.- La tierra tiene recursos naturales en abundancia, tan sólo
tenemos que aprender a explotarlos
n16.- Para conseguir el desarrollo sostenible, es
necesaria una situación económica equilibrada en la que esté
controlado el crecimiento industrial
English
translation:
New Ecological Paradigm Scale. 16 items Vozmediano
and San Juan version (2005)
n1.- The idea that humanity will face a global ecological crisis has
been greatly exaggerated
n2.- The balance of nature is strong enough to
cope with the impact that industrialized countries will cause
n3.- Over time, humans can learn enough about how nature works to be
able to control
n4.- Human ingenuity will ensure that we do not make the earth
uninhabitable
n5.- Humans were created to dominate the rest of
nature
n6.- Humans have the right to modify the environment to suit their
needs
n7.- When humans interfere with nature, often the consequences are
disastrous
n8.- Plants and animals have as much right as humans to exist
n9.- Humans are severely abusing the environment
n10.- The balance of nature is very delicate and easily alterable
n11.- If things continue as before, will soon experience a major
ecological catastrophe
n12.- We are approaching the limit number of people the earth can
hold
n13.- The earth is like a spaceship with limited
resources and space
n14.- Despite our special abilities, humans are still subject to the
laws of nature
n15.- The earth has natural resources in abundance, so we just have
to learn to exploit
n16.- To achieve sustainable development, balanced
in an economic situation which is controlled industrial growth is
necessary
Annex II
Escala de conectividad con la naturaleza.
c1.- A menudo tengo un sentimiento de unidad con el mundo natural que
me rodea.
c2.- Pienso en el mundo natural como una comunidad
a la que pertenezco.
c3.- Reconozco y aprecio la inteligencia de otros organismos
vivientes.
c4.- A menudo me siento desconectado de la naturaleza.
c5.- Cuando pienso en mi vida, me imagino ser
parte de un proceso cíclico, más amplio, de la vida.
c6.- A menudo siento una afinidad con las plantas y los animales.
c7.- Siento que pertenezco a la tierra en la misma medida que ella me
pertenece a mí.
c8.- Tengo una comprensión profunda de cómo mis
acciones afectan el mundo natural.
c9.- A menudo me siento parte de la red de la vida.
c10.- Creo que todos los habitantes de la Tierra, humanos y no
humanos, comparten una "fuerza vital" común.
c11.- Al igual que un árbol es parte del bosque,
me siento parte de un mundo natural más amplio.
c12.- Cuando pienso en mi lugar en la Tierra, me considero en la
parte más alta de una jerarquía existente en la naturaleza.
c13.- A menudo me siento simplemente como una
pequeña parte del mundo natural que me rodea, y que yo no soy más
importante que la hierba de la tierra o las aves de los árboles.
c14.- Mi bienestar personal es independiente del bienestar del mundo
natural.
English
transalation:
The connectedness with nature Scale.
c1.- often have a feeling of oneness with the
natural world around me.
c2.- I think of the natural world as a community to which I belong.
c3.- greatly appreciate the intelligence of other living organisms.
c4.- I often feel disconnected from nature.
c5.- When I think of my life, I imagine being part
of a broader cyclical process of life.
c6.- often feel an affinity with plants and animals.
c7.- feel I belong to the land to the same extent that it belongs to
me.
c8.- have a deep understanding of how my actions affect the natural
world.
c9.- I often feel part of the web of life.
c10.- I think that all the inhabitants of the earth, human and
nonhuman, share a common "life force".
c11.- Like a tree is part of the forest, I feel part of a larger
natural world.
c12.- When I think about my place on earth, I
believe in the highest part of an existing hierarchy in nature.
c13.- I often feel just like a small part of the natural world around
me, and that I am no more important than the grass of the earth or
the birds in the trees.
c14.- My personal welfare is independent of the
welfare of the natural world.
Annex
III
R code in order to analyze the CNS Scale through IRT Models.
> DCNS<-Dat_cns
> descript(DCNS)
> mod_1<-rasch(DCNS, constraint=cbind(length(DCNS)+1,1))
> summary(mod_1)
> GoF.rasch(mod_1, B=199)
> margins(mod_1)
> mod_2<-ltm(DCNS~z1)
> summary(mod_2)
> margins(mod_2)
> mod_3<-tpm(DCNS, type="rasch", max.guessing=1)
> summary(mod_3)
> margins(mod_3)
> anova(mod_1, mod_2)
> anova(mod_1,mod_3)
> anova(mod_2,mod_3)
> information(mod_2, c(-4,4))
> factor.scores(mod_2, resp.patterns=DCNS)
> # Gráfico
> par(mfrow=c(2,2))
> plot(mod_2, legend=T, cx="bottomright", lwd=3,
cex.main=1.5, cex.lab=1.3, cex=1.1)
> plot(mod_2, type="IIC", annot=F, lwd=3, cex.main=1.5,
cex.lab=1.3)
> plot(0:1, 0:1, type="n", ann=F,
axes=F)
> info_1_1<-information(mod_2, c(-4,0))
> info_1_2<-information(mod_2, c(0,4))
> text(0.5, 0.5, labels=paste("Información
total:", round(info_1_1$InfoTotal, 3), "\n\nInformation in
(-4,0):", round(info_1_1$InfoRange, 3), paste("(",
round(100*info_1_1$PropRange, 2), "%)", sep=" "),
"\n\nInformation in (0,4):", round(info_1_2$InfoRange,3),
paste ("(", round (100* info_1_2$PropRange,2), "%)",
sep=" ")), cex=1.5)
Annex IV
R code in order to analyze the NPA Scale through IRT Models.
> DNPA<-Dat_npa
> descript(DNPA)
> mod_1<-rasch(DNPA,
constraint=cbind(length(DNPA)+1,1))
> summary(mod_1)
> GoF.rasch(mod_1, B=199)
> margins(mod_1)
> mod_2<-ltm(DNPA~z1)
> summary(mod_2)
> margins(mod_2)
> mod_3<-tpm(DNPA, type="rasch", max.guessing=1)
> summary(mod_3)
> margins(mod_3)
> anova(mod_1, mod_2)
> anova(mod_1,mod_3)
> anova(mod_2,mod_3)
> information(mod_2, c(-4,4))
> factor.scores(mod_2, resp.patterns=DNPA)
> par(mfrow=c(2,2))
> plot(mod_2, legend=T, cx="bottomright", lwd=3,
cex.main=1.5, cex.lab=1.3, cex=1.1)
> plot(mod_2, type="IIC", items= 0,
lwd=3, cex.main=1.5, cex.lab=1.3)
> plot(mod_2, type="IIC", annot=F, lwd=3, cex.main=1.5,
cex.lab=1.3)
> plot(0:1, 0:1, type="n", ann=F,
axes=F)
> text(0.5, 0.5, labels=paste("Total
Information:", round(info1$InfoTotal, 3), "\n\nInformation
in (-4,0):", round(info1$InfoRange, 3), paste("(",
round(100*info1$PropRange, 2), "%)", sep=""),
"\n\nInformation in (0,4): ", round(info2$InfoRange, 3),
paste("(",round(100 * info2$PropRange, 2), "%)",
sep="")), cex=1.5)