
of Technology and Educational Innovation
Vol. 10. No. 1. Junio 2024 - pp. 166-183 - ISSN: 2444-2925
DOI: https://doi.org/10.24310/ijtei.101.2024.17747
Kyrgyz Students’ Acceptance of QR Code Use in Organic Chemistry Course
 Esta obra está bajo licencia internacional Creative Commons Reconocimiento-NoComercial-CompartirIgual 4.0.
1. INTRODUCTION
QR codes can be used in education as a tool that arouses attention and intellectual activity of students, and enhances their enthusiasm in learning (Mileva, & Stoyanova, 2017). In education, QR codes can be used for sharing content, engaging learners having various needs and facilitating learning (Abdul Rabu et al., 2019). The utilization of QR codes gives fast access to the essential materials for the study of this topic and allows the student not to spend time searching for the necessary information (Uçak, 2019).
The literature review revealed that there are existing studies that analyzed teacher and student perceptions related to the use of QR codes in education. For instance, Ali et al. (2017) showed that teachers perceive QR codes as simple and effective tools to support educational activities. Moreover, learners are also satisfied about the use of this technology, as it is quite easy to use.
Karahan and Bilici (2017) examined the opinion of middle school science teachers on the use of QR code technology in learning. The results showed that the use of QR code in science classes has a positive effect on the interest, motivation and active participation of students. Situmoranga et al. (2019) revealed that the use of QR code gives students quick access to the essential learning resources for the development of the topic and allows them to study independently. Uçak (2019) analyzed the opinions of future science teachers about the use of QR codes in a course. The participants of the study indicated that QR codes can enrich and support the teaching process.
The literature confirms the positive perception towards the use of QR codes in education by both teachers and students. QR codes are seen as effective tools, with studies revealing benefits such as increased student interest and academic performance. The findings highlight the potential of QR codes to enhance teaching and learning experiences, particularly in science education (e.g., Artemova et al., 2021; González-Rosende et al., 2020). However, further research is recommended to determine optimal strategies for integrating QR codes and improving their effectiveness (Uçak, 2019).
1.1. Statement of the problem
There is a little number of studies devoted to the study of attitudes towards the use of QR code in the instructional area from teacher and student perspectives (Abdul Rabu et al., 2019). The attitude towards the use of QR code in the educational process in a number of studies of the countries of the distant and near abroad is very positive, a number of publications have demonstrated this. However, the authors of this paper found no information about the use of QR codes in the educational process in Kyrgyzstan. To close this gap, this study attempts to examine the attitude of university and high school level Kyrgyz students towards the use of QR codes in the Organic Chemistry course and presents the results. The authors of this article believe that the evaluation of the perception of the QR code use in natural sciences teaching will be interesting. Thus, for the successful implementation of QR code in natural sciences teaching it is necessary to study the factors that influence it.
1.2. Theoretical background and hypotheses
In order to investigate the acceptance of a technology, researchers generally employ Technology Acceptance Model (TAM) and Unified Theory of Acceptance and Use of Technology (UTAUT) models (Afacan, & Çinar, 2021). TAM investigates users’ perceptions related to a new technology through two main criteria (Davis, 1989). According to TAM, perceived usefulness and perceived ease of use are important factors in the acceptance or rejection of new information technology. UTAUT was designed to explain the user’ intentions to use an information system through four factors: performance expectancy, effort expectancy, social influence, and facilitating conditions (Venkatesh et al., 2003). Then, in 2012, UTAUT2 was proposed with the integration of three additional constructs: hedonic motivation, price value and habit (Venkatesh et al., 2012).
This study aimed to investigate the university and high school level Kyrgyz students’ perceptions related to the use of QR codes in textbooks for the demonstration of experimental works in Organic Chemistry course. The study proposed a research model based on two existing models: TAM and UTAUT2. Although the combination of these models was mostly employed in the context of mobile learning, their combined use towards the acceptance of QR codes is limited (Abdul Rabu et al., 2018). Applying these models in a combined way makes it possible to study students’ perception of the use of QR codes in Organic Chemistry textbook.
The research model of the study considered factors of the TAM and UTAUT2, and based on the study of Abdul Rabu et al. (2018). The study covers the constructs of TAM such as perceived usefulness, perceived ease of use, attitude, and behavioral intention to use QR codes. In addition, the study involves social influence, facilitating conditions, and hedonic motivation constructs of the UTAUT2. The overall research model was provided in Figure 1.
FIGURE 1. Structure of the Research Model.
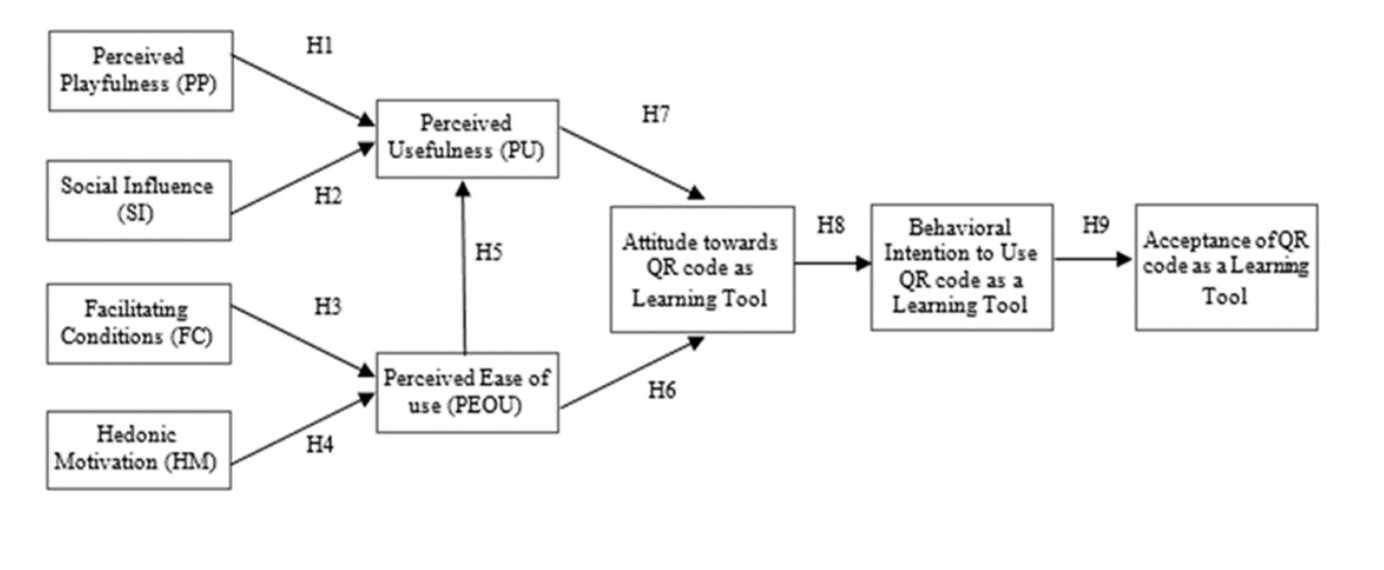
The constructs of the research model and the corresponding hypotheses are provided as follows:
1.2.1. Effects of perceived playfulness (PP) and social influence (SI) on perceived usefulness (PU)
Playfulness is considered as a factor influencing perceived usefulness of a new technology. Abdul Rabu et al. (2018) considers that while students view the use of this exact technology like a game, they have the perception that the tool is valuable for concurrent instructional and playing aims.
Tan and Chou (2008) aimed to investigate perceived playfulness according to services related to mobile information and entertainment. They analyzed a number of studies that have demonstrated the importance of playfulness in the wider Internet context, online shopping, and mobile Internet services. Based on results of these studies, they stated that perceived playfulness takes an important role in above mentioned technologies’ acceptance. Similarly, Abdul Rabu et al. (2018) studied the link between perceived playfulness and perceived usefulness in QR code acceptance at the Universiti Sains Malaysia. Our research puts forward this hypothesis within the Kyrgyz context.
Social influence also has an impact on the usefulness perception of the new technology. Gao (2023) offered that the feelings of individual users are influenced by the opinion of authoritative people for them. These people’s opinions may encourage their use of a new technology.
According to Al Mansoori et al. (2018), social influence can also be defined as the degree of peer influence on the use of a particular system. Yang and Choi (2001) found that the direct or indirect impact of social influences on technology perception varied across technologies. The results may vary depending on the nature of the technology. The proposed hypotheses (i.e., H1 and H2) will allow investigation of the influence of factors such as perceived playfulness and social influence on the perceived usefulness of QR code use:
- H1: Perceived playfulness of QR codes has a positive impact on students’ perceived usefulness of QR codes in learning.
- H2: Social influence has a positive impact on students’ perceived usefulness of QR codes in learning.
1.2.2. Effects of facilitating conditions (FC) and hedonic motivation (MV) on perceived ease of use (PEOU)
Facilitating conditions refer to the existing organizational and technical infrastructure supporting people to use the system (Venkatesh et al., 2003). Triandis (1980) states that if objective conditions in the environment prevent any behavior, it will not occur. For instance, in the context of computer use, user support is considered as one important facilitating condition that can influence the system utilization (Thompson et al., 1991). The existence and accessibility of physical equipment or supportive facilities has an important role for the use of new technologies (Abdul Rabu et al., 2018). In this study, the authors aimed to investigate students’ perceptions of QR code. This technology is easy to apply and learn. Therefore, students expected to accept it positively.
Hedonic motivation is defined as “the fun or pleasure derived from using technology” (Tamilmani, 2019). According to the authors’ opinion, hedonic motivation is an important determinant of consumer’s technology acceptance and use. Al-Azawei and Alowayr (2020) offered the hedonic motivation as the fun and engagement hence leads to enhancing overall performance. Per the above, the study hypothesizes that:
- H3: Facilitating conditions have a positive impact on students’ perceived ease of use of QR codes for learning.
- H4: Students’ hedonic motivation in using QR codes have a positive impact on their perceived ease of use of QR codes in learning.
1.2.3. Relationship between perceived ease of use (PEOU) and perceived usefulness (PU)
Perceived usefulness was defined as “the degree to which a person believes that using a particular system would enhance his or her job performance” (Davis, 1989, p.320), and perceived ease of use was defined as “the degree to which a person believes that using a particular system would be free of effort” (Davis, 1989, p. 320). According to the TAM, the perceived usefulness and perceived ease of use affect the person’s attitude toward the system. These factors influence his intention to use the system. Thus, they determine the actual use of the system (Davis, 1989).
It is also proposed that perceived ease of use is affecting perceived usefulness. It assumed that the easier to use the system, the more useful it would be perceived. Sometimes the system is perceived by users as not useful and not easy to use. In such a case, the acceptability of the system to users is reduced (Carter, & Bélanger, 2005). Similarly, usefulness and ease of use factors are expected to affect students’ perceptions of QR code use. Accordingly, the study proposes that:
- H5: Students’ perceived ease of use of QR codes has a positive impact on their perceived usefulness of QR codes for learning.
1.2.4. Relationship between attitude (ATT) and Behavioural intention (BI)
Some studies consider the attitude of people towards the use of a system. El-Gayar et al. (2011) confirmed that students’ beliefs about productivity and easy-to-use features of systems will positively affect their attitudes towards a new technology. Hence, the authors stated that technologies aiming positive influence on students’ attitudes (and thus acceptance) should consider performance and effort expectancy issues.
Ifenthaler and Schweinbenz (2016) assumed that the degree to which a student believes that using the new technology will help to improve his or her performance will have a positive effect on his or her attitude toward the new technology.
Nair and Das (2012) considered the hypotheses related to fundamental constructs of TAM. According to their study, perceived ease of use was expected to have an influence on perceived usefulness. In turn, perceived ease of use and perceived usefulness can both together influence attitudes toward use.
Abdul Rabu et al. (2018) assumed that students’ emotional reaction related to QR code is related to their usage intentions, which are affected by both their perceived ease of use and perceived usefulness. Hence, we propose that:
- H6: Students’ perceived ease of use of QR codes have a positive impact on their attitude towards usage for learning.
- H7: Students’ perceived usefulness of QR codes have a positive impact on their attitude towards usage for learning.
- H8: Students’ attitudes towards QR codes have a positive impact on their behavioural intentions to use for learning.
1.2.5. Relationship between Behavioural intention (BI) and Actual Use (AU)
The studies of Chang et al. (2017), Iskandar et al. (2020), Jameel et al. (2020), Shanmugam et al. (2014) and Venkatesh et al. (2012) supposed that there is a positive relationship between behavioral intention and actual use behaviour. Behavioral intention can positively influence students’ acceptance of QR code as a learning tool (Abdul Rabu et al., 2018). Based on the above point of view, our study proposes the following hypotheses:
- H9: Students’ behavioural intention towards QR codes has a positive impact on their actual use of QR codes for learning.
2. MATERIAL AND METHOD
2.1. Research methodology
This study aimed to analyze university and high school students` acceptance of the QR code technology with the use of the Partial Least Squares Structural Equation Modeling (PLS-SEM). The research model of the study is based on the TAM and UTAUT2, related to students’ attitude, facilitating condition, hedonic motivation, perceived ease of use, perceived playfulness, perceived usefulness, social influence, and behavioral intention for the acceptance of QR code use in the Organic Chemistry course.
In this study, correlational research design was employed to explore the relation among factors of the research model. For the identification of the participants, the study employed the purposive sampling method, which is suitable for acquiring data from particular group of participants or events (Taherdoost, 2016).
2.2. Participants
The technology of teaching the discipline “Organic Chemistry” using the QR code began to be applied in the spring semester of 2020-2021 academic year. It was actively applied during 4 semesters. This made it possible to conduct a survey among the students who used this textbook during the “Organic Chemistry’’ course. The survey was mainly completed by students of three Kyrgyz universities and by students in one high school. Demographic data of participants are provided in Table 1.
TABLE 1. Demographic Data of Participants.
| Variables | Frequency (f) | Percentage (%) | |
| Gender | Female | 118 | 57.8 |
| Male | 85 | 41.7 | |
| Age | 15-17 | 19 | 9.3 |
| 18-20 | 106 | 52.0 | |
| 21-23 | 60 | 29.4 | |
| 23 + | 13 | 6.4 | |
| Level of Education | High school | 19 | 9.3 |
| University | 185 | 90.7 | |
| Total | 204 | 100 |
In total, 204 students participated in this study. It can be seen that female participants were 118 and male participants 85, representing 57.8% and 41.7% correspondingly. According to the demographics, female participants were more than male ones. The age distribution of participants demonstrated that the age of participants ranges between 15 and 23+ and most participants are in the age of 18-20 with 52%. This is followed by the 21-23 age group with 29.4%. The level of education results showed that participant students are mostly studying at university level.
2.3. Research setting
The Organic Chemistry textbook started to be used in 2021 at several universities in Kyrgyzstan and in one private high school. The Kyrgyz language is used in these universities and in this school as the language of education.
The Organic Chemistry course is taught to students of specialties “Chemical engineering”, “Ecology”, “Food engineering”, “Veterinary”, “Agronomy”, “Biology”, and “Chemist-biologist”. It is also used in the high school for advanced chemistry studies. The textbook is also helpful for teachers of chemistry in preparation for classes.
Teaching the course “Organic Chemistry” at universities is as follows. The course lasts for a 16-week semester. Students have 2 hours of lectures and 2 hours of laboratory work per week. During the lecture, theoretical material is explained to students. To perform experimental work, students are divided into small groups of 3-4 people. Further, they independently study the course of the experiment described in the textbook. Using the QR code placed in the textbook next to the description of the experiment, students can go to the video of the experiment posted on YouTube. Each video shows the required reagents, their quantity, the sequence of the experiment. Students can repeat the experiment at the laboratory of the educational institution.
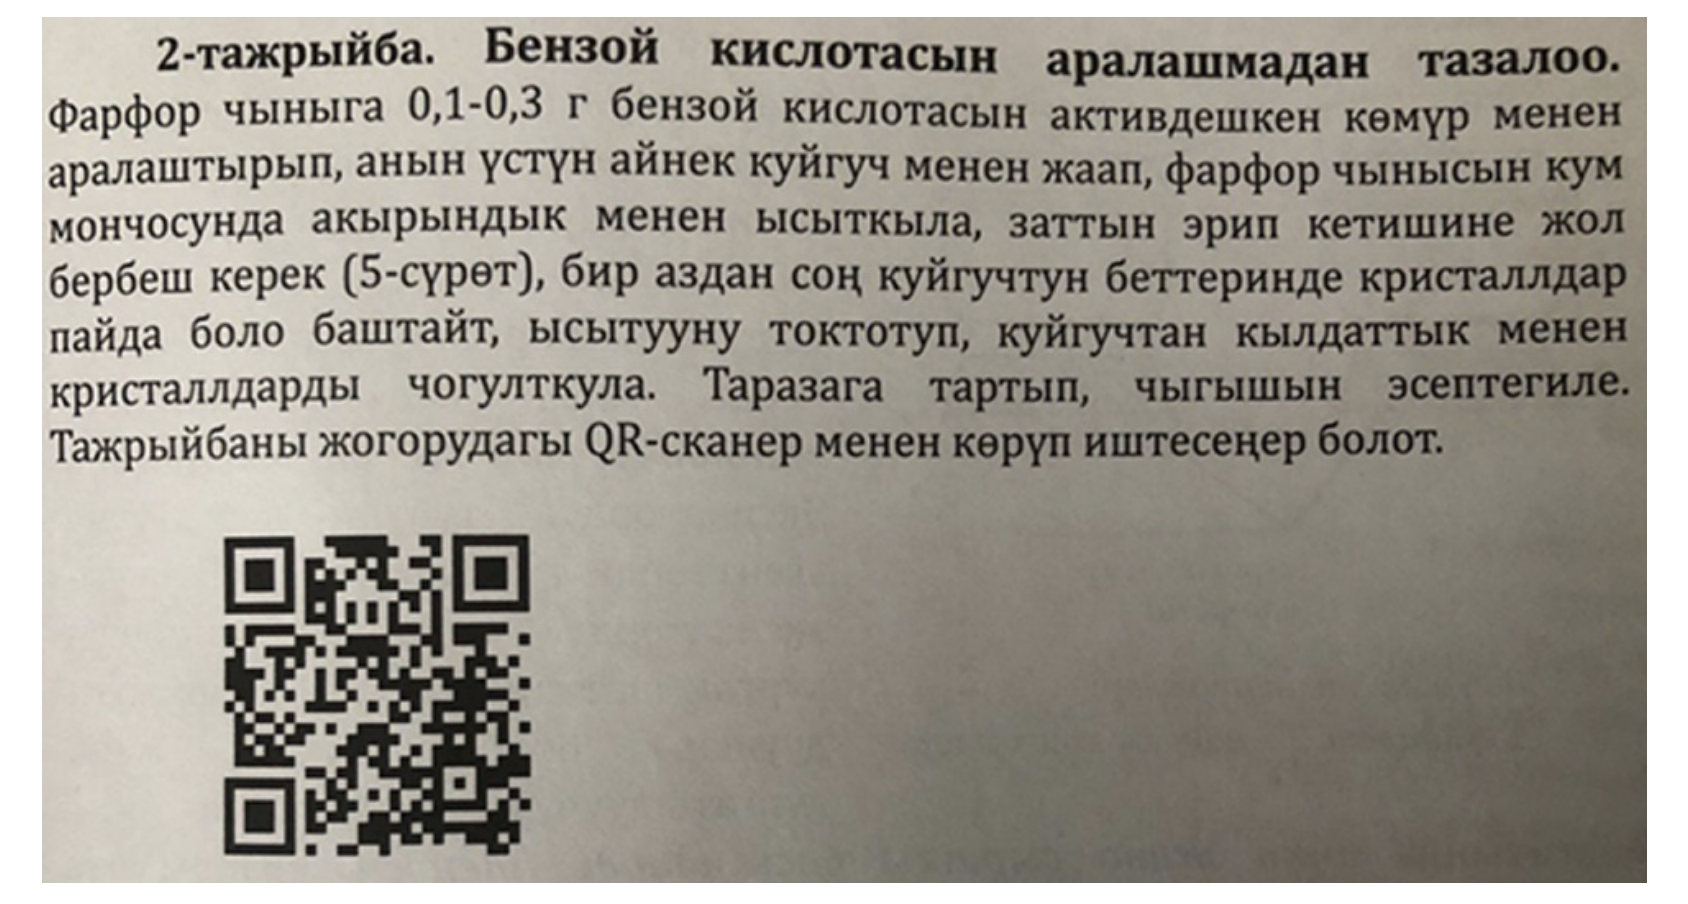
The Figure 2 below shows a fragment from the textbook with a description of the experiment and a QR code for it. Figure 2 provides the following description of the experimental work: “Experiment 2. Purification of benzoic acid from the mixture. Mix 0.1-0.3 g of benzoic acid with activated carbon in a porcelain cup, cover with a glass burner, heat the porcelain cup on a sand bath slowly, and do not allow the substance to melt. After a while crystals begin to form on the surface of the burner. Stop heating and carefully collect the crystals from the burner. Weigh it and calculate the result. You can try an experiment by viewing it using the QR code provided.” The video of the experiment, available via the QR code above, is located at the Youtube platform.
FIGURE 2. A fragment from the textbook with a description of the experiment and a corresponding QR code.
2.4. Measurements
The survey of the study allows the researchers to analyze the acceptance of QR codes by students. The survey considered factors of the TAM and UTAUT2, and based on the study of Abdul Rabu et al. (2018). Hence, the survey consists of items of attitude, facilitating condition, hedonic motivation, perceived ease of use, perceived playfulness, perceived usefulness, social influence, behavioral intention, and acceptance of QR code constructs. The original survey was translated to Kyrgyz and shared with students taking the Organic Chemistry course in three Kyrgyz universities and in one high school. For the ethical agreement, related applications were done to collect data.
2.5. Data Analysis
Data analysis was done through SPSS (Version 28) and Smart-PLS (Version 4) software. The data analysis covers appropriate analysis for measurement model and structural model. In this respect, reliability analysis, convergent validity, discriminant validity, and Partial Least Squares Structural Equation Modeling (PLS-SEM) analysis was applied to analyze the effects of factors on students’ acceptance of QR codes.
3. RESULTS
3.1. Measurement Model
For the measurement model, the initial analysis covers reliability analysis, convergent validity, composite reliability, as well as average variance extracted. These assessments were obtained as the results of PLS algorithm and confirmatory factor analysis (CFA).
3.1.1. Reliability Analysis
Initially, reliability analysis was conducted to identify whether the factors are parallel with the hypothesized results. The results in Table 2 revealed that Cronbach’s Alpha values are ranging from 0.841 to 0.950. Since the values are higher than the threshold value 0.70, they were found appropriate for the reliability (Kline, 1999).
TABLE 2. Reliability Analysis Results.
| Constructs | Cronbach’s Alpha |
| Acceptance of QR Code (AQC) | 0.887 |
| Attitude (ATT) | 0.950 |
| Behavioral Intention (BI) | 0.947 |
| Facilitating Conditions (FC) | 0.872 |
| Hedonic Motivation (HM) | 0.865 |
| Perceived Ease of Use (PEOU) | 0.937 |
| Perceived Playfulness (PP) | 0.841 |
| Perceived Usefulness (PU) | 0.935 |
| Social Influence (SI) | 0.909 |
3.1.2. Internal Consistency (Reliability and Validity)
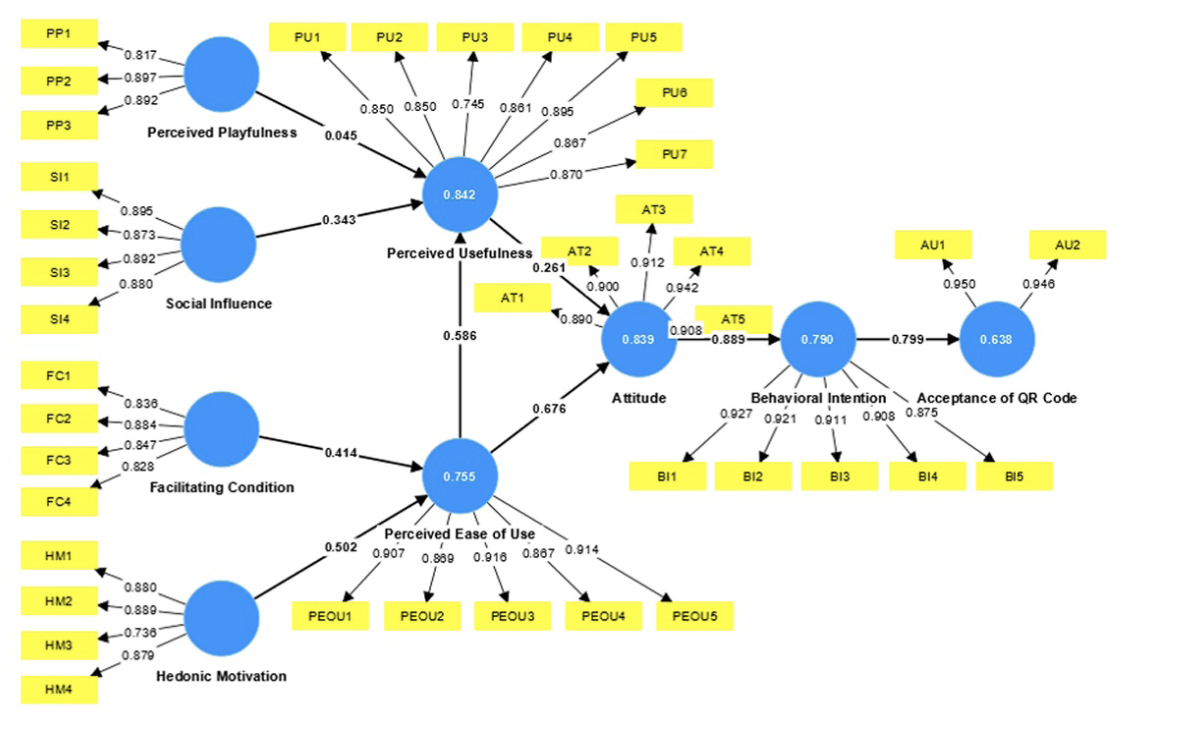
The Figure 3 shows the outer loadings of CFA with PLS algorithm. The values among factors and their items represent the outer loading values. All of the outer loadings are higher than the threshold value 0.7 proposed by Hair et al. (2017).
FIGURE 3. PLS Algorithm for CFA.
In addition, Table 3 reveals that rho_A and composite reliability values are higher than 0.7 (ranging from 0.843 to 0.949) and (ranging from 0.911 to 0.960), hence confirming the reliability of the model.
Convergent validity investigates whether the measures should relate are really related (Trochim, n.d.). Convergent validity is checked with respect to the average variance extracted (AVE) values. Each AVE value (between 0.721 and 0.898) was found to be higher than the threshold value - 0.5, so verifying the convergence (Fornell, & Larcker, 1981). Overall, the values in Table 3 resulted that the internal consistency was satisfied for the measurement model.
TABLE 3. Results for Internal Consistency.
| Constructs | rho_A | Composite reliability | Average variance extracted (AVE) |
| AQC | 0.888 | 0.946 | 0.898 |
| ATT | 0.949 | 0.960 | 0.829 |
| BI | 0.948 | 0.959 | 0.826 |
| FC | 0.875 | 0.912 | 0.721 |
| HM | 0.879 | 0.911 | 0.719 |
| PEOU | 0.939 | 0.953 | 0.801 |
| PP | 0.843 | 0.903 | 0.756 |
| PU | 0.937 | 0.948 | 0.721 |
| SI | 0.909 | 0.935 | 0.784 |
3.1.3. Discriminant validity
Discriminant validity investigates whether the measures should not relate are really not related (Trochim, n.d.). Fornell and Larcker (1981) test was employed to examine discriminant validity. In Table 4, diagonal values show the square roots of AVE values and other values show the correlation between constructs. Discriminant validity is satisfied since the square root of each construct’s AVE is higher than its every correlation between other constructs (Fornell, & Larcker, 1981).
TABLE 4. Results for discriminant validity.
| Constructs | AQC | ATT | BI | FC | HM | PEOU | PP | PU | SI |
| AQC | 0.948 | ||||||||
| ATT | 0.755 | 0.911 | |||||||
| BI | 0.799 | 0.889 | 0.909 | ||||||
| FC | 0.729 | 0.788 | 0.766 | 0.849 | |||||
| HM | 0.724 | 0.834 | 0.800 | 0.800 | 0.848 | ||||
| PEOU | 0.777 | 0.908 | 0.875 | 0.815 | 0.833 | 0.895 | |||
| PP | 0.705 | 0.762 | 0.775 | 0.758 | 0.812 | 0.780 | 0.870 | ||
| PU | 0.778 | 0.862 | 0.831 | 0.865 | 0.853 | 0.888 | 0.770 | 0.849 | |
| SI | 0.749 | 0.815 | 0.813 | 0.822 | 0.819 | 0.779 | 0.782 | 0.835 | 0.885 |
3.2 Structural Model
3.2.1. Path Analysis
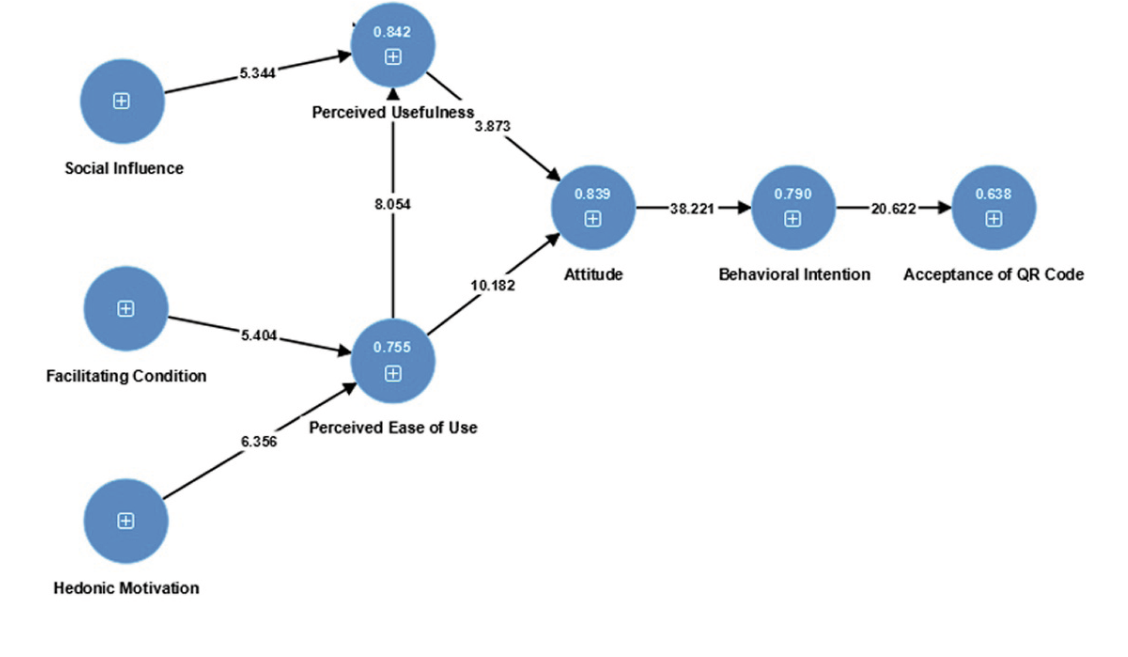
In order to conduct the path analysis, the first bootstrapping sequence with 1000 samples were performed in PLS. Figure 4 demonstrates the corresponding graphical results related to the path analysis. The values between variables represent the t values.
FIGURE 4. Bootstrap results for path relationships.
3.2.2. Path coefficients
Table 5 provides the results for the path relationships in the hypothesized model. It was explored that PEOU was significantly affected by FC (t = 5.404, p<0.05) and HM (t = 6.356, p<0.05). PU was significantly affected by PEOU (t = 8.054, p<0.05) and SI (t = 5.344, p<0.05). Yet, it was found that PP has no significant effect on PU (t = 0.833, p>0.05). For the attitude (ATT) towards QR code integration, both PEOU (t = 10.182, p<0.05) and PU (t = 3.873, p<0.05) were found as significant predictors. ATT( t= 38.221, p<0.05) was found as the significant antecedent of the BI. And, actual use of QR codes was significantly predicted by BI (t = 20.622, p<0.05).
TABLE 5. Path analysis results.
| Confidence interval | ||||
| t values | p values | LL | UL | |
| ATT -> BI | 38.221 | 0.000** | 0.849 | 0.924 |
| BI -> AQC | 20.622 | 0.000** | 0.727 | 0.856 |
| FC -> PEOU | 5.404 | 0.000** | 0.297 | 0.547 |
| HM -> PEOU | 6.356 | 0.000** | 0.362 | 0.620 |
| PEOU -> ATT | 10.182 | 0.000** | 0.561 | 0.778 |
| PEOU -> PU | 8.054 | 0.000** | 0.464 | 0.702 |
| PP -> PU | 0.833 | 0.202 | -0.038 | 0.136 |
| PU -> ATT | 3.873 | 0.000** | 0.161 | 0.378 |
| SI -> PU | 5.344 | 0.000** | 0.237 | 0.444 |
3.2.3 Derived Model
Figure 5 provides the derived model together with the paths having significance. The values between factors represent the t values. PP was removed from the model, since its effect on PU was found non significant.
FIGURE 5. Derived model.
3.2.4. Coefficient of determination (R2)
Coefficient of determination indicates the variance explained by each construct in the research model. Table 6 below provides the coefficient of determination values for the endogenous constructs in the research model of the study. The values range from 0.758 to 0.938. Since these values are higher than 0.70, the variance explained by each construct was high based on criteria of Kline (2015).
TABLE 6. Coefficient of determination values for the endogenous constructs.
| Construct | R-square |
| Acceptance of QR Code | 0.758 |
| Attitude | 0.926 |
| Behavioral Intention | 0.879 |
| Perceived Ease of Use | 0.864 |
| Perceived Usefulness | 0.938 |
4. DISCUSSION
This study investigated the acceptance of QR code technology in the “Organic Chemistry” course among university and high school students in Kyrgyzstan. The research model is based on the Technology Acceptance Model (TAM) and the Unified Theory of Acceptance and Use of Technology 2 (UTAUT2). Similar research models have been successfully applied in various contexts, such as examining students’ initial perceptions of QR codes (Abdul Rabu et al., 2018), analyzing the intentions of future teachers to use Web 2.0 technologies in their courses (Şimşek, & Ateş, 2022), exploring students’ attitudes towards distance learning programs (Onyekwere, & Enamul Hoque, 2023), and investigating students’ behavior regarding the adoption of cloud-based virtual platforms (Sayginer, 2023). The current study identified social influence, facilitating conditions, hedonic motivation, perceived usefulness, and perceived ease of use as significant factors influencing students’ acceptance of QR code usage in the Organic Chemistry course.
Social influence, as defined by Mei-Ying et al. (2012), examines whether users are influenced by others to adopt a particular technology. In the context of this study, social influence was found to exert a significant positive effect on students’ perceived usefulness of QR codes in the learning process. This aligns with the findings of Chooi et al. (2014) and Moorthy et al. (2014), who also observed a significant and positive impact of social influence on students’ intentions to use QR codes as an instructional tool. Students’ decisions to embrace QR codes are shaped by the opinions of their peers and instructors. Hence, the study suggests that when students receive support or assistance from their friends and instructors, they are more likely to perceive QR codes as useful and exhibit greater acceptance of their use in the Organic Chemistry course.
Facilitating conditions refer to the availability of organizational and technical infrastructure supporting users’ acceptance of a technology (Venkatesh et al., 2012). Factors such as the lack of necessary technical devices, the need for additional software installation, and extra training may pose obstacles to the adoption of new technology. Previously, these factors acted as barriers to the widespread adoption of technology (Durak et al., 2016). The results indicated that students’ perceived ease of use of QR codes was significantly influenced by facilitating conditions. Similar findings have been observed in other studies. For example, Sukendro et al. (2020) demonstrated that available facilities, an appropriate environment, and Internet access facilitate students’ acceptance of e-learning. Additionally, Moorthy et al. (2014) identified a positive influence of facilitation conditions on students’ behavioral intention to use QR codes in education. Before incorporating QR code technology into courses, instructors can provide guidance on its use. Furthermore, students can receive support when facing issues related to the use of QR codes. This approach ensures that students have the opportunity to understand QR code usage and safely integrate QR technologies into their learning experience.
Our results align with those of a study conducted by Chyou et al. (2012) that investigated the adoption of QR code services in Japan and Taiwan. The key factors influencing behavioral intention were found to be social influence and facilitating conditions, followed by perceived ease of use and perceived usefulness. The successful adoption of QR code technology in Japan was attributed to the availability of information and technical support from various companies. In contrast, in Taiwan, the lack of such support led to less awareness of QR codes among the general population, despite their widespread availability. QR code usage eliminates the need for additional device purchases, software installations, and instructional requirements, making the technology more accessible. The current prevalence of smartphones with QR code scanning programs and affordable Internet access among students and teachers in Kyrgyzstan (Sultanov, 2023) provides a solid foundation for the further development of this technology.
Hedonic motivation, defined as “the fun or pleasure derived from using a technology” (Escobar-Rodríguez et al., 2014, p. 138), was a focal point in the current study, investigating whether students perceived the use of QR codes as enjoyable, entertaining, and interesting as a learning tool. The findings revealed that hedonic motivation significantly and positively influenced the perceived ease of use. Similar results are evident in the existing literature. For instance, Twum et al. (2022) identified a significant effect of hedonic motivation on students’ intention to use e-learning. Likewise, Chang et al. (2017) explored how hedonic value significantly affected the attitudes of auto-repairing students toward the use of QR codes in learning. Nikolopoulou et al. (2021) examined the influence of hedonic motivation on the intention to use new technology in the future, emphasizing the pivotal role of the initial experience. They contend that the first encounter with technology plays a significant role; a positive initial experience increases the likelihood of continued use. In the context of teaching Organic Chemistry, students’ positive experiences with using QR codes were noted, encouraging their further adoption of this technology, as confirmed by the conducted analysis.
Perceived usefulness refers to users’ beliefs about the positive impact on their performance when utilizing technologies (Davis, 1989). This study aimed to determine if learners perceived QR codes as useful, given their access to relevant information, faster completion of learning activities, and time-saving benefits during tasks. The study revealed that perceived usefulness significantly and positively influenced students’ attitudes toward using QR codes in learning. Similarly, Durak et al. (2016) found that students acknowledged the positive effects of QR codes on learning, particularly through visuals and updated information. In a parallel study, Nazar et al. (2022) demonstrated that students found QR codes useful for learning about chemical instruments, using appropriate media, while minimizing risks of accidents in a laboratory environment. The effective use of QR codes in teaching promotes a better understanding of the material and enhances accessibility to learning resources, especially for students with special educational needs (Pastor et al., 2015). In the context of learning organic chemistry, QR codes offer quick and easy access to multimedia content such as videos and additional course-related information. This accessibility improves students’ comprehension of complex chemical processes and reactions (Nazar et al., 2022). In addition, the integration of QR codes into educational materials allows students to engage in just-in-time training and access video materials to develop practical skills (Schulz, & Ottolini, 2023).
Perceived ease of use refers to the participants’ ideas about easiness of the technology (Davis, 1989). From the perspective of this study, it is important to investigate whether learners could easily learn scanning QR codes and whether they gain expert in using QR codes for learning. It was revealed that perceived ease of use has a positive and significant influence on students’ attitudes towards QR code use in learning. As one construct of TAM, it was also found important for users’ acceptance of QR codes and different technologies in the current literature. For example, Del Rosario-Raymundo (2017) revealed that participants found the use of QR codes easy as a mobile learning instrument. Karia et al. (2019) suggested that QR guidelines can be provided to students for the appropriate use of the QR code technology. Despite the fact that all participating students possess a mobile device and are accustomed to using mobile systems, the current study revealed that students’ attitudes are influenced by factors associated with user-friendliness. Specifically, the research revealed the significance of providing students with convenient access to the system. This finding suggests that for QR codes to gain widespread acceptance from students, it is crucial to ensure their user-friendliness with clear guides in the Organic Chemistry course.
5. CONCLUSIONS
This study revealed that social influence, facilitating conditions, hedonic motivation, perceived usefulness, and perceived ease of use are significant factors influencing students’ acceptance of QR code usage in the Organic Chemistry course. Students prefer using QR codes in Organic Chemistry textbooks to access video materials when encouraged by instructors and peers. Therefore, for the successful adoption of QR code usage in learning, it is crucial for students to receive necessary support and assistance from their instructors and peers. Students’ existing knowledge, along with available resources, also plays a vital role as facilitating conditions. When students acquire essential knowledge for using QR codes, they can access videos and gain insights related to the Organic Chemistry course. In this context, interactive guides can be developed to assist students in learning how to use QR codes. The integration of interactive functions into QR technologies for the Organic Chemistry course would enhance students’ adoption. Fun and interesting systems can be provided through the incorporation of interactive features into QR technologies for the Organic Chemistry course.
Students’ acceptance of QR codes is likely to increase when they are provided with easy-to-use and useful systems. From the students’ perspective, QR codes are easily accessible through mobile devices for retrieving learning materials in the Organic Chemistry course. In terms of usefulness, students can efficiently complete learning activities and save time by using QR codes as a learning tool. When integrating QR codes into the Organic Chemistry course, attention to these aspects is essential for fostering acceptance of this technology.
5.1. Limitations and future lines of research
The sample size is one limitation in this study. The number of students who submitted responses to the questionnaire was not as high as anticipated. Therefore, in the upcoming studies it would be valuable to acquire data from a group with large number of students. Another limitation was that surveys were used for the collection of data. In forthcoming studies, interviews can be organized with students to understand more about their use related to QR codes. In this way, qualitative analysis can be conducted for a more comprehensive analysis of students’ acceptance of QR codes in learning. Hence, it can be potential to better reveal constructs related to the acceptance of QR codes. The other limitation is the lack of moderating variables in the research model. In a future study, the effects of demographic variables such as gender, academic level can be considered for the comprehensive investigation of the research model.
6. REFERENCES
Abdul Rabu, S. N., Hussin, H., & Bervell, B. (2019). QR code utilization in a large classroom: Higher education students’ initial perceptions. Education and Information Technologies, 24(1), 359-384. https://doi.org/10.1007/s10639-018-9779-2
Afacan, G., & Çinar, M. (2021). The Acceptance and Use of an Online Exam System by Online Learners: Implementation of the UTAUT Model. Sakarya University Journal of Education, 11(3), 412-430. https://doi.org/10.19126/suje.830529
Al-Azawei, A., & Alowayr, A. (2020). Predicting the intention to use and hedonic motivation for mobile learning: A comparative study in two Middle Eastern countries. Technology in Society, 62, 1-12. https://doi.org/10.1016/j.techsoc.2020.101325
Ali, N., Santos, I. M., & Areepattamannil, S. (2017). Pre-service teachers’ perception of quick response (QR) code integration in classroom activities. Turkish Online Journal of Educational Technology-TOJET, 16(1), 93-100.
Al Mansoori, K. A., Sarabdeen, J., & Tchantchane, A. L. (2018). Investigating Emirati citizens’ adoption of e-government services in Abu Dhabi using modified UTAUT model. Information Technology & People, 31(2), 455-481. https://doi.org/10.1108/ITP-12-2016-0290
Artemova, E., S. Shishalova, Y., Melnikov, S., Orekhova, O., & Nikiporets-Takigawa, G. (2021). El Uso de Códigos QR y su eficacia en la Aplicación de competencias profesionales. Apuntes Universitarios, 12(1), 419-435. https://doi.org/10.17162/au.v12i1.978
Carter, L., & Bélanger, F. (2005). The utilization of e-government services: citizen trust, innovation and acceptance factors. Information Systems Journal, 15(1), 5-25. https://doi.org/10.1111/j.1365-2575.2005.00183.x
Chang, C. T., Hajiyev, J., & Su, C. R. (2017). Examining the students’ behavioral intention to use e-learning in Azerbaijan? The general extended technology acceptance model for e-learning approach. Computers & Education, 111, 128-143. https://doi.org/10.1016/j.compedu.2017.04.010
Chooi, W. J., Chooi, W. Y., Lee, S. H., Ng, S. K., & Ng, W. S. (2014). Determinants affecting behavioral intention of using QR codes as a learning tool (Doctoral dissertation, Universiti Tunku Abdul Rahman). UTAR. http://eprints.utar.edu.my/1413/
Chyou, J. J. T., Kang, H. C., & Cheng, B. Y. F. (2012). Acceptance Of Qr Code In Taiwan: An Extension Of The Technology Acceptance Model. PACIS 2012 Proceedings. 12. https://aisel.aisnet.org/pacis2012/12
Davis, F. D. (1989). Perceived usefulness, perceived ease of use and use acceptance of information technology. MIS Quarterly, 13(3), 319-339.
Del Rosario-Raymundo, M. R. (2017). QR codes as mobile learning tools for labor room nurses at the San Pablo Colleges Medical Center. Interactive Technology and Smart Education, 14(2), 138-158. https://doi.org/10.1108/ITSE-02-2017-0015
Durak, G., Ozkeskin, E. E., & Ataizi, M. (2016). QR codes in education and communication. Turkish Online Journal of Distance Education, 17(2), 42-58.
El-Gayar, O., Moran, M., & Hawkes, M. (2011). Students’ acceptance of tablet PCs and implications for educational institutions. Journal of Educational Technology & Society, 14(2), 58-70.
Escobar-Rodríguez, T., Carvajal-Trujillo, E., & Monge-Lozano, P. (2014). Factors that influence the perceived advantages and relevance of Facebook as a learning tool: An extension of the UTAUT. Australasian Journal of Educational Technology, 30(2), 136-151. https://doi.org/10.14742/ajet.585
Fornell, C., & Larcker, D. F. (1981). Evaluating structural equation models with unobservable variables and measurement error. Journal of Marketing Research, 18(1), 39-50. https://doi.org/10.1177/00222437810180010
Gao, B. (2023). Understanding smart education continuance intention in a delayed benefit context: An integration of sensory stimuli, UTAUT, and flow theory. Acta Psychologica, 234, 1-13. https://doi.org/10.1016/j.actpsy.2023.103856
González-Rosende, M. E., Bueso-Bordils, J. I., Castillo, E., Martínez-Solís, I., & Murgui-Martínez, J. M. (2020, March 2-4). QR codes for blended learning in organic chemistry lab classes and Pharmaceutical Botany Workshops: A study case. INTED Proceedings. 14th International Technology, Education and Development Conference. Valencia, España. https://doi.org/10.21125/inted.2020.0572
Hair, J. F., Hult, G. T. M., Ringle, C. M., & Sarstedt, M. (2017). A primer on partial least squares structural equation modeling (2nd ed.). Sage.
Ifenthaler, D., & Schweinbenz, V. (2016). Students’ acceptance of tablet PCs in the classroom. Journal of Research on Technology in Education, 48(4), 306-321. https://doi.org/10.1080/15391523.2016.1215172
Iskandar, M., Hartoyo, H., & Hermadi, I. (2020). Analysis of factors affecting behavioral intention and use of behavioral of mobile banking using unified theory of acceptance and use of technology 2 model approach. International Review of Management and Marketing, 10(2), 41-49. https://doi.org/10.32479/irmm.9292
Jameel, A. S., Abdalla, S. N., & Karem, M. A. (2020, November). Behavioural Intention to Use E-Learning from student’s perspective during COVID-19 Pandemic. In 2020 2nd Annual international conference on information and sciences (AiCIS) (pp. 165-171). IEEE.
Karahan, E., & Bilici, S. C. (2017). Use of QR codes in science education: Science teachers’ opinions and suggestions. Necatibey Faculty of Education Electronic Journal of Science & Mathematics Education, 11(1), 433-457.
Karia, C. T., Hughes, A., & Carr, S. (2019). Uses of quick response codes in healthcare education: a scoping review. BMC Medical Education, 19(1), 1-14. https://doi.org/10.1186/s12909-019-1876-4
Kline, P. (1999). The handbook of psychological testing (2nd ed.). Routledge.
Mei-Ying, W., Pei-Yuan, Y., & Weng, Y. C. (2012). A study on user behavior for i pass by UTAUT: Using taiwan’s MRT as an example. Asia Pacific Management Review, 17(1), 91-111.
Mileva, N., & Stoyanova, D. (2017, November 16-18). A methodological approach for using QR codes in Education. ICERI Proceedings. 10th annual International Conference of Education, Research and Innovation. Sevilla, España. https://doi.org/10.21125/iceri.2017.2296
Moorthy, M. K., Jing, C. W., Yue, C. W., Siewhwa, L., SokKuan, N., & Shin, N. W. (2014). Determinants affecting behavioural intention of using QR codes as a learning tool. International Journal of Physical and Social Sciences, 4(12), 54-73.
Nair, I., & Das, V. M. (2012). Using Technology Acceptance Model to assess teachers’ attitude towards use of technology as teaching tool: A SEM Approach. International Journal of Computer Applications, 42(2), 1-6.
Nazar, M., Nurmalahayati, N., Rusman, R., Puspita, K., & Haris, A. (2022). Introducing Chemical Instruments through Quick Response Code (QR-Code) Based Website. Jurnal Penelitian Pendidikan IPA, 8(3), 1083-1088. https://doi.org/10.29303/jppipa.v8i3.1361
Nikolopoulou, K., Gialamas, V., & Lavidas, K. (2021). Habit, hedonic motivation, performance expectancy and technological pedagogical knowledge affect teachers’ intention to use mobile internet. Computers and Education Open, 2, e100041. https://doi.org/10.1016/j.caeo.2021.100041
Onyekwere, J., & Enamul Hoque, K. (2023). Relationship between technological change, digitization, and students’ attitudes toward distance learning in Lagos Higher Education institutes. Innoeduca. International Journal of Technology and Educational Innovation, 9(1), 126-142. https://doi.org/10.24310/innoeduca.2023.v9i1.15286
Pastor, G. C., Sánchez-Adsuar, M. D., & Miguel, J. (2015, June). Proposal of QR Codes Implementation in Teaching Methodology. ICERI Proceedings. 10th annual International Conference of Education, Research and Innovation. Sevilla, España.
Sayginer, C. (2023). Acceptance and use of cloud-based virtual platforms by higher education vocational school students: application of the UTAUT model with a PLS-SEM approach. Innoeduca. International Journal of Technology and Educational Innovation, 9(2), 24-38. https://doi.org/10.24310/innoeduca.2023.v9i2.15647
Schulz, E. V., & Ottolini, K. M. (2023). Teaching with QR codes: Accessible technology for the novice educator. eLearn, 2023(2 Special Issue), art.6. https://doi.org/10.1145/3583062.3566130
Shanmugam, A., Savarimuthu, M. T., & Wen, T. C. (2014). Factors affecting Malaysian behavioral intention to use mobile banking with mediating effects of attitude. Academic Research International, 5(2), 236-253.
Situmoranga, R., Siangb, J. L., Ibrahimc, N., & Lagunsiangd, J. (2019). Development of collaborative learning materials based on QR code to facilitate learning. Development, 8(6), 85-98.
Şimşek, A. S., & Ateş, H. (2022). The extended technology acceptance model for Web 2.0 technologies in teaching. Innoeduca. International Journal of Technology and Educational Innovation, 8(2), 165-183. https://doi.org/10.24310/innoeduca.2022.v8i2.15413
Sukendro, S., Habibi, A., Khaeruddin, K., Indrayana, B., Syahruddin, S., Makadada, F. A., & Hakim, H. (2020). Using an extended Technology Acceptance Model to understand students’ use of e-learning during Covid-19: Indonesian sport science education context. Heliyon, 6(11), e05410. https://doi.org/10.1016/j.heliyon.2020.e05410
Sultanov, A. (2023, November 18). Kyrgyzstan ranked 15th in world in terms of Internet cost -. 24.Kg. https://24.kg/english/280086_Kyrgyzstan_ranked_15th_in_world_in_terms_of_Internet_cost/
Taherdoost, H. (2016). Sampling methods in research methodology; How to choose a sampling technique for research. International Journal of Academic Research in Management (IJARM), 5(2), 18-27. http://dx.doi.org/10.2139/ssrn.3205035
Tamilmani, K., Rana, N. P., Prakasam, N., & Dwivedi, Y. K. (2019). The battle of Brain vs. Heart: A literature review and meta-analysis of “hedonic motivation” use in UTAUT2. International Journal of Information Management, 46, 222-235. https://doi.org/10.1016/j.ijinfomgt.2019.01.008
Tan, F. B., & Chou, J. P. (2008). The relationship between mobile service quality, perceived technology compatibility, and users’ perceived playfulness in the context of mobile information and entertainment services. Intl. Journal of Human-Computer Interaction, 24(7), 649-671. https://doi.org/10.1080/10447310802335581
Thompson, R. L., Higgins, C. A., & Howell, J. M. (1991). Personal computing: Toward a conceptual model of utilization. MIS Quarterly, 15(1), 125-143. https://doi.org/10.2307/249443
Triandis, H. C. (1980). Values, attitudes, and interpersonal behavior. In H. Howe, & M. Page (Eds.), Nebraska symposium on motivation (V. 27, pp. 195-259). University of Nebraska Press.
Trochim, W. M. K. (n.d.). Research Methods Knowledge Base. https://conjointly.com/kb/
Twum, K. K., Ofori, D., Keney, G., & Korang-Yeboah, B. (2022). Using the UTAUT, personal innovativeness and perceived financial cost to examine student’s intention to use E-learning. Journal of Science and Technology Policy Management, 13(3), 713-737. https://doi.org/10.1108/JSTPM-12-2020-0168
Uçak, E. (2019). Teaching materials developed using QR code technology in science classes. International Journal of Progressive Education, 15(4), 215-228.
Venkatesh, V., Morris, M. G., Davis, G. B., & Davis, F. D. (2003). User acceptance of information technology: Toward a unified view. MIS Quarterly, 27(3), 425-478. https://doi.org/10.2307/30036540
Venkatesh, V., Thong, J. Y., & Xu, X. (2012). Consumer acceptance and use of information technology: extending the unified theory of acceptance and use of technology. MIS Quarterly, 36(1), 157-178. https://doi.org/10.2307/41410412
Yang, H. D., & Choi, I. (2001). Revisiting technology acceptance model with social influence factors. PACIS 2001 proceedings, 35. https://acortar.link/w17enR