|
|
EUROPEAN JOURNAL OF FAMILY BUSINESS |
|


Ownership, productivity and firms’ life-cycle
Aurora Galegoa,*, Natércia Mirab, Jacinto Vidigal da Silvaa
aUniversidade de Évora and CEFAGE-UE
bUniversidade de Évora
Received 15 September 2018; accepted 12 December 2018
JEL CLASSIFICATION
G32, D24, C23, C33
KEYWORDS
family firms, productivity, life-cycle, Cobb–Douglas production function, endogeneity.
Abstract Empirical evidence on productivity differences between family owned and non-family owned firms is still sparse and reveals conflicting results. Unlike previous studies, we analyse the effect of the firm’s life cycle on productivity using a large sample of non-listed firms. Furthermore, we consider a model with heterogeneity of inputs between the two types of firms and addressing possible endogeneity problems. We conclude that there are no significant differences in productivity between family and non-family firms, for both startup/growth and mature stages of life cycle. Furthermore, labour seems to be the main determinant of family firms’ productivity, which is especially evident for firms in the mature stage.
CÓDIGOS JEL
G32, D24, C23, C33
PALABRAS CLAVE
Empresas familiares; Productividad; Ciclo de vida; Funcion de producción Cobb-Douglas; endogeneidad
Propiedad, productividad y ciclo de vida las empresas
Resumen La evidencia empírica sobre las diferencias de productividad entre las empresas familiares y no familiares es aún escasa y revela resultados contradictorios. A diferencia de estudios anteriores, analizamos el efecto del ciclo de vida de la empresa en la productividad utilizando una gran muestra de empresas no cotizadas. Además, consideramos un modelo con heterogeneidad de aportes entre los dos tipos de empresas y abordando posibles problemas de endogeneidad. Concluimos que no hay diferencias significativas en la productividad entre las empresas familiares y no familiares, tanto para el inicio / crecimiento como para las etapas maduras del ciclo de vida. Además, la mano de obra parece ser el principal determinante de la productividad de las empresas familiares, lo cual es especialmente evidente para las empresas en la etapa de madurez.
Introduction
The relation between firm ownership and performance is a growing topic in the literature; see inter alia Anderson and Reeb, 2003; Villalonga and Amit, 2006; Chrisman et al., 2004; Arosa et al., 2010. However, few researchers have studied the impact of family ownership on the fundamental driver of performance, which is productivity. Standing out, among others in this group, are the studies by Martikainen et al. (2009) and Palia and Lichtenberg (1999) about quoted firms and those by Barbera and Moores (2013), Morikawa (2013), Barth et al. (2005) and Bosworth and Loundes (2002), which considered small and medium-sized enterprises (SMEs).
SMEs account for 99.8% of all firms in the European Union (European Commission, 2015), of which 70% to 80% are family firms (Mandl, 2008). The importance of these firms for economic and social development justifies carrying out more studies about the determinants of performance, as is the case of productivity.
The central objective of this paper is to provide further evidence on whether family ownership has a positive or negative effect on productivity and how it changes along the firms’ life cycle, as well as on the contribution of production factors. In particular, we aim to provide answers to the following questions: Do family owned firms display higher productivity than non-family firms?; Do labour and capital factors contribute equally to production in family firms than in non-family firms?; Do productivity differences between family owned and non-family owned firms change along the different life-cycle stages?
We consider the case of Portugal, which, according to the European pattern, has a high percentage of family firms, representing around two thirds of total turnover and 50% of employment (Mandl, 2008). We use a large sample of non-listed manufacturing firms (from the SABI database, provided by Bureau van Dijk). Besides being the first and the largest empirical study on productivity in family firms in Portugal, our approach differs from previous studies in other aspects.
Firstly, this study contributes to family firm literature by investigating the effect of a firms’ life cycle on productivity differences between family and non-family owned firms. Empirical evidence in these topics is not common. Studies on family firms’ productivity typically focus on the impact of the ownership on productivity without considering differences along the firms’ life-cycle (e.g. Barbera and Moores, 2013, Mannarino et al., 2011). On the other hand, studies about firms’ life-cycle focus on its effects on property control (e.g. Frank et al., 2012), on the evolution of firms’ performance (Sridharan and Joshi, 2016) as well as on financial problems (Rocca et al., 2011). As far as we know, no previous study has analysed the differences in productivity along firms’ life-cycle stages between family and non-family firms.
Secondly, this study presents a methodological contribution by not assuming homogeneity of inputs and by considering a recent method to address endogeneity problems in the estimation of the production function. In fact, unlike most empirical analyses about productivity in family firms, we do not assume homogeneity of inputs in the production functions (one exception is Barbera and Moores, 2013), that is, that labour and capital output contributions for both types of firms are the same. Hence, possible differences in the output contribution of production inputs between family firms and non-family firms are considered. Also, in general, previous research does not fully address endogeneity problems in estimation of the production function, particularly endogeneity due to simultaneity between the choice of inputs and productivity shocks. In this work, we take into account endogeneity by employing the method proposed by Wooldridge (2009). To the best of our knowledge, no previous study on family owned firms’ productivity has employed this method to consider endogeneity problems.
The remainder of this paper is organized as follows. The second section presents a literature review about the impact of firm ownership on performance, taking as reference the differences between family and non-family firms identified in the literature. Based on this review, hypotheses are formulated about the difference in productivity and in the contribution of production factors between family and non-family firms, along the life-cycle. The third section describes the empirical methodology and discusses the data used in the analysis. The fourth section reports and analyses our empirical findings. The final section concludes (the paper).
Background and Hypotheses
Evidence of the impact of ownership on productivity is scarce and results have not been consensual. Researchers focusing on quoted firms mainly report a positive effect of family ownership on productivity (e.g. Górriz and Fumas, 1996; Martikainen et al., 2009). The results about the impact of family ownership in studies considering only non-listed firms or both quoted and non-listed firms, reveal that the effect on productivity is either insignificant or negative (Barbera and Moores, 2013, Bosworth and Loundes, 2002, Barth et al., 2005; Mannarino et al., 2011).
Most studies assume input homogeneity (specifically labour and capital) between family and non-family firms. Only two studies have considered that firms may diverge in the use and contribution to output of production factors, because of their different concerns, objectives, motivations and behaviour. The results of Martikainen et al. (2009) for quoted firms in the US show no significant differences in production technologies and the authors conclude that the higher production efficiency of family owned firms is caused by their more efficient use of labour and capital resources. On the contrary, Barbera and Moores (2013), considering Australian SMEs, conclude that these two types of firms differ in the use of capital and labour factors.
Considering the specific characteristics of family firms resulting from the strong inter-relationship between family and business, we can expect differences in their objectives and in the strategies for allocating resources. These differences are related to the emotional context, family values, altruism and the alignment of objectives that characterize family firms’ management which do not occur in other firms.
In this respect, differences in human resource management practices stand out. The literature suggests that family firms adopt less professionalized practices (De Kok, Uhlamer at al., 2006), prefer informal training (Kotey and Folker, 2007) and pay lower salaries, but provide greater job security (Bassassini et al., 2013). This informality in the decision process, as well as the adoption of more long-term perspectives (Harris and Reid, 2008) and the family atmosphere of trust and cohesion associated with a policy of conservative payment, contribute to motivate employees and increase labour productivity.
These management characteristics relate to the model of governance adopted by family firms. Based on great dedication to the continuity of the business, creating a culture of community with employees and close connections with clients, Miller et al. (2008) and Miller and Le Breton-Miller (2006) showed that the stewardship theory model is applicable to family firm governance.
The overlap between ownership and management may lead to the absence of agency costs linked to control. At the same time, it ensures close alignment between family and firm interests and a policy of lower salaries explained by the emotional link between managers/owners and firms. This leads to the creation of a climate of informality and employees’ great proximity to family members, which favours involvement (Mandl, 2008), commitment (Azoury et al., 2013) and employee satisfaction (Huang et al., 2015; Block et al., 2013). Given these specific characteristics and the difficulty of replicating them in non-family firms, they may be an important competitive advantage for family firms.
Considering top management, the results about the relationship between the presence of a family CEO and performance are ambiguous, although most recent studies point towards a negative relationship. For example, Anderson and Reeb (2003) confirm better performance of family member CEOs because they understand the business and behave as stewards of the firm. However, Villalonga and Amit (2006) and Pérez-González (2007) identify lower performance of family member CEOs, explained by the smaller recruitment base of family firms. In turn, Bennedsen et al. (2007) show that the presence of family CEOs has an extremely negative causal effect on firm performance, whereas external CEOs have the opposite effect. As the literature suggests family firms are generally reluctant to take on external CEOs in order to prevent a loss of control (Gómez-Mejía et al. 2011) and that family member CEOs remain in the post much longer than their non-family equivalents (Gómez-Mejía et al., 2001), irrespective of the results obtained, we may expect less efficient top management in family firms.
Considering the characteristics of human resources management previously discussed and the results of Barbera and Moores (2013), concluding that the labour factor in family firms contributes significantly more to production, we may expect greater efficiency of the labour factor in family firms. To confirm this assumption, we test the following null hypothesis:
H1: There is a greater contribution of the labour factor to production in family firms than in non-family firms.
Family firms may also show a different contribution of capital. In fact, Barbera and Moores (2013) conclude that the capital factor contributes significantly less to production than in non-family firms. This difference can be explained by the characteristics of capital structure and investment decisions. Schmid (2013) identified the desire to keep control and avoid excessive risk as the main determinants of financing decisions. Most studies confirm that family firms are more risk averse (Hiebl, 2013) and that this criterion is very important in the investment decision (Anderson et al., 2012).
Despite the great amount of research, the literature about the differences in capital structure remains inconclusive (Ampenberger et al., 2013). Some studies identified greater debt in family firms (e.g. Croci et al., 2011; King and Santor, 2008; and Blanco-Mazagatos et al., 2007); while others, such as Schmid (2013), Ampenberger et al. (2013) and Anderson et al. (2012) found the opposite result of greater debt in non-family firms.
More important than the differences in the capital structure is the difference in the cost of capital. According to the agency theory, the overlap between ownership and management in family firms may substantially reduce agency problems, which produces positive effects on the cost of capital (Ang et al., 2000). However, other authors, such as Schulze et al. (2001) or Schulze et al. (2003), argue that significant agency costs may occur as a result of inefficient behaviour and conflicts among family owners.
The effects of greater risk aversion in family firms were analysed in the scope of agency theory by Le Breton-Miller and Miller (2009), who concluded on under-investment in the area of business renewal and innovation. A growing number of studies demonstrate that family firms invest less in R&D than non-family ones (Patel and Chrisman, 2014; Block, 2012; and Munari et al., 2010) due to the greater risk and the desire to preserve socioemotional wealth.
Although most studies assume homogeneity of the capital factor in the production function, considering the differences in the financial decisions previously discussed and the result of Barbera and Moores (2013), we can expect less efficiency of this factor in family firms, and hence we test the following null hypothesis:
H2: There is a lower contribution of the capital factor to production in family firms than in non-family firms.
The theoretical prepositions and empirical results about the differences between family and non-family firms discussed above also affect the firms’ productivity. Like Barbera and Moores (2013), we want to investigate the effect of family ownership on productivity. This can be explained by the resource-based view, which states that family firms have unique capabilities, resources and relationships that non-family firms cannot develop. Families may influence firm performance due to the interaction of these family factors with business variables (Habbershon and Williams, 1999; Habbershon et al., 2003; Sirmon and Hitt, 2003). This interaction between the family and productive activities can generate strategic resources, which are themselves sources of competitive advantages.
On the contrary, family firms’ financing preferences can have a negative effect on competitiveness. These companies prefer to generate funds internally (Blanco-Mazgatos et al. 2007, Romano et al. 2001) as opposed to external financing, so as to avoid risk and sharing control (e.g., Coutts, 2005; DGPYME, 2003). This choice affects the availability of capital and investment and can affect competitiveness if it results in using obsolete equipment because of the difficulty in replacing it. As this problem does not arise to the same extent in non-family firms, it can create differences in competitiveness between these two types of firm.
The factors previously discussed and the governance model, more oriented to the use of control mechanisms, as predicted by agency theory, determine a firm’s productivity. These features have impact on the objectives and on the management of resources, affecting firms’ efficiency in several different ways. Hence, all together these effects have an impact on productivity, which leads us to test the difference between family and non-family firms by studying the following hypothesis:
H3: Taking into account different input contributions, there is no difference in productivity between family and non-family firms.
Our work differs from previous studies by considering the hypothesis of differences in productivity along a firms’ life cycle. These differences can be explained by the factors described above related to financing and growth or to the change in strategic orientation. (e.g. Molly et al., 2012; Martin and Lumpkin, 2004). This analysis is based on a vision of firm’s life-cycle, which begins with the founder’s strong control of ownership that gradually dwindles over time.
At the initial start-up stage, the characteristics of entrepreneurs and businesses are very similar. There is a vision towards business, ideas, intellectual capital and growth opportunities (Hand, 2005). Founders typically hold a significant part of ownership and remain in power for many years. Founders’ personal characteristics are common to both types of firms
, with priority given to entrepreneurial activity and building the business rather than the role as a member of the family (Miller et al., 2013).
As the characteristics previously described do not show substantial differences between the two types of firms in the start-up/growth stage, we can accept at the outset that there is no difference in productivity. To confirm this assumption, we test the following hypothesis
H4: There is no difference in productivity between family owned firms in start-up/growth stage and non-family firms on the same stage.
Given the differences is time perspectives for family firms assumed by James (1999), who states that these firms favour long term strategies, and the findings of Mandl (2008), who confirms that family firms give priority to long term sustainability and to the challenges of ownership and management transfer, we cannot expect the previous hypothesis to be true in other stages of firms’ life-cycle.
The literature identifies management problems in more advanced stages of the family firms life-cycle, which often results from ownership transfer to descendants (e.g. Molly et al., 2010 ; Villalonga and Amit, 2006). In particular, these problems are related with increased conflict between family members (e.g. Eddleston and Kellermanns, 2007), less business talent and fewer management competences (e.g. Cucculelli and Micucci, 2008), less work capacity and lower ethics in descendants (Morck and Yeung, 2003) and the lack of financial resources (Miller and Le Bretton-Miller, 2006 and Upton and Petty, 2000).
Other studies justify stagnation with the diminishing entrepreneurial orientation in subsequent generations of family firms (Martin and Lumpkin, 2004). Zellweger and Sieger (2012) concluded that ownership transfer to descendants has a negative impact on internal autonomy and innovation, and the opposite effect on pro-activeness and competitive aggressiveness. This maybe also justified by the fact that leaders remain in their positions longer in family firms, as identified by Brenes et al. (2011) and McConaughy (2000).
This evolution, which is not common in non-family firms, is described in the literature as a change in strategic orientation – from the entrepreneurial perspective of business renewal to a conservative vision of greater risk aversion and giving priority to protecting the family (e.g. Martin and Lumpkin, 2004 and Molly et al., 2010). Family orientation prioritizes stability and preservation of the family heritage rather than the competitive aggressiveness that characterizes business orientation (Martin and Lumpkin, 2004), which authors such as Lumpkin and Dess (2001) found to be closely related to performance.
According to Chrisman et al. (2008), an important distinction between family and non-family firms lies in how they formulate and implement strategies and how these affect performance. The strategic change previously discussed may generate both positive and negative effects on productivity in mature stage family firms that do not occur in non-family ones. No previous studies have investigated the possible differences between the two types of firm in mature stages. However, given the expected differences in strategies, we test the following hypothesis:
H5: Family firms in mature stage have lower productivity than non-family firms in the same stage.
Methodology and Data
Empirical Methodology
As previous studies, the empirical analysis is based on a standard Cobb-Douglas production function:
 (1)
(1)
Where  is the logarithm of the Added Value of firm
  at time
  ,
,  is the log of capital,
  is the log of labour,
  is a standard error term and
  represents firms’ productivity, which is assumed to be observed by the firm but not by the econometrician.
OLS estimation of the previous equation requires all inputs to be exogenous. However, it is commonly assumed that labour is an input that can adjust more rapidly than capital when the firm faces a productivity shock. Therefore, labour is considered a freely variable factor and capital a state variable. As labour adjusts to current productivity shocks, OLS estimation of the production function provides biased estimates. In fact, we have an endogeneity bias due to simultaneity, that is, firms know productivity at the time they choose their inputs and it is likely that an increase in productivity will lead to an increase in labour.
Consequently, several alternative estimators have been suggested in the literature to overcome endogeneity. It has been recognized that traditional methods like fixed-effects estimation techniques, despite taking firm heterogeneity into account, do not solve the simultaneity problem when productivity shocks change over time. Similarly, instrumental variables methods have a number of problems, particularly related to the difficulty of finding appropriate instruments. In fact, in general, both fixed-effects and instrumental variables methods seem to provide unreliable estimators (Ackerberg et al., 2007). The latest solutions to deal with this problem extend the semi-parametric approach of Olley and Pakes (1996), such as the estimators of Levinsohn and Petrin (2003) or Ackerberg et al. (2006). All these authors suggested two-step methods using proxies for unobserved productivity shocks.
More recently, Wooldridge (2009) proposed a single-step method, estimating the first and second stage of previously suggested methods simultaneously, within a GMM framework. Wooldridge (2009) argues that this alternative is more efficient as, unlike the two-step approaches, it takes into account potential contemporaneous correlation in the errors across the two equations (corresponding to the two steps) and it allows for serial correlation and heteroskedasticity in the error terms. In this paper the Wooldridge (2009) approach is adopted.
As in Levinsohn and Petrin (2003) or Olley and Pakes (1996), a proxy for productivity shocks (materials or investment) is needed. Considering materials as a proxy, the demand for this intermediate input is assumed to depend on the firm´s capital  and the productivity shock
  :
:
 (2)
(2)
This function can be inverted if the monotonicity condition is met and materials are increasing in :
 (3)
(3)
By using (3) we can rewrite the equation (1) as:

Further, the dynamics of productivity shocks is restricted by assuming:
 (5)
(5)
Plugging,  into equation (1), we get a second equation:
 (6)
(6)
To estimate the model and to identify both  and
and  we need to specify functions
  and
and  . These can be approximated by a polynomial of the third degree or less. In this paper a polynomial of the third degree for and of the first degree for is chosen, further assuming that productivity follows a random walk with drift. In this case, the following system of equations is to be estimated in a GMM framework:
 (7)
(7)
The above equations have different sets of instruments, where the lag length of instruments is limited to one period. Specifically, for the first equation the instruments are labour, capital and a third degree polynomial of capital and materials, and for the second equation, lagged labour, capital and a third degree polynomial of lagged capital and lagged materials.
Since the objective is to analyse productivity differences between family firms and non-family firms, in the empirical analysis the standard Cobb-Douglas production function (1) is extended in several ways. First, a dummy variable (family), taking the value of one for a family firm and zero otherwise, is introduced. Second, to take into consideration possible differences in capital and labour inputs between family owned and non-family owned firms, interactions between the dummy variable of family and inputs are also included. Moreover, a set of dummy variables to control the industrial sector, year and region is introduced.
Therefore, the following extended version of the Cobb-Douglas production function is considered:
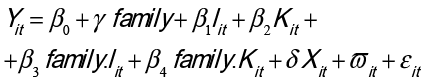 (8)
(8)
Where  stands for the control variables. The system of equations (7) as well as the set of instruments changed accordingly. In both equations the control variables act as their own instruments.
Data
Data from the SABI (Analysis System of Iberian Balance Sheets) database supplied by Bureau van Dijk is used. This is considered to be a representative dataset of the Portuguese firms, containing financial information for all industrial sectors and that is commonly used in studies about industry. Our study focuses on the manufacturing sector (similarly to Palia and Lichtenberg, 1999 or Martikainen et al., 2009) including non-listed firms for the period 2006 to 2009 located in mainland Portugal. We chose to consider data up to 2009, as this is the year before the external adjustment programme started in Portugal. The economic crisis, which has shaken the country since 2009, could in fact affect the results.
The sample includes firms that present positive values for all the variables used in the study for at least one year. Moreover, exit and entry of new firms is allowed, which implies that the sample includes firms that survived over the entire period of analysis and those that did not. Therefore, the final sample contains a total of 18,981 firms in 2006 and an unbalanced panel between 2006 and 2009 (due to free entry and exit of firms, but also to missing values in the variables used) comprising a total of 75,365 observations1.
One key aspect in the study is how to identify family owned firms. The literature contains a variety of definitions of a family business and there is no consensus among researchers (López-Gracia and Sánchez-Andújar, 2007). In general, three main criteria define a family firm. The first is based on who takes the most important management decisions (Filbeck and Lee, 2000), the second relates to capital ownership (Donckels and Lambrecht, 1999), and finally the last criterion is based on the possibility of passing the business to future generations (McConaughy and Phillips, 1999).
As in other studies, the availability of data limits the decision on which criteria to use. In this study capital ownership is considered and a similar criterion to the one used by López-Gracia and Sánchez-Andújar (2007) is followed. Hence, family firms are those with a shareholder, single or family, who owns more than 50% of the total shares, for each year of the time period. Consequently, in our sample around 74% of the observations are family firms (55,804) and more than 70% are micro firms. These percentages are according to the structure of the Portuguese manufacturing sector (Banco de Portugal, 2016). The importance of family firms is also similar to other studies that have analysed family business performance considering non-listed firms for other countries (Arosa et al., 2010; Chrisman et al. 2004).
In the empirical analysis, as dependent variable measuring firm output, the logarithmic of the Added Value (lnAV)2 is used. Labour input (in logarithms -lnlabour) is measured by the number of employees, as hours of work per employee are not available in the dataset.
Capital input (also in logarithms- lncapital) is proxied by the sum of equity and debt3 (following Barth et al, 2005). Due to many missing observations for the investment variable in the data, causing the loss of a large number of observations, the logarithm of input materials (lnmaterials) is used as a proxy variable for productivity shocks in the Wooldridge (2009) method. To deflate monetary values the appropriate producer price index for each manufacturing industry is used, and therefore all variables are at 2005 prices. The price indices are taken from the National Institute of Statistics (INE- http://www.ine.pt).
In order to control for possible industry bias, following most previous authors, 22 dummy variables are included to control for heterogeneity across industry sectors for manufacturing (one dummy variable for each two-digit level of the Portuguese Standard Industrial Classification system – CAE- which is correlated with Eurostat Nace Rev.2 taxonomy. Repair and installation of machinery and equipment is the reference category)4. Also, 4 regional dummies (North, Centre, Alentejo and Algarve. Lisbon is the reference category) and year dummies are introduced.
To study productivity differences along the different stages of the firms’ life cycle, we follow Mandl (2008) classification: start-up/growth, mature and declining stages. In this paper we focus on the first two stages and according to studies such as that of Gersick et al. (1997), Blanco-Mazagatos et al. (2007) and Santarelli and Lotti (2005), we consider firms with 25 years of age or less in the start-up / growth phase.
Thus, our sample was divided into two groups. The group of firms with 25 years of age or less (start-up/growth stage) and firms over 25 years of age that are in the mature stage. In our sample, the majority of both family and non-family firms are 25 years old or less. In fact, in 2006 about 84% of family firms are in the start-up/growth stage whereas only about 68,7% of non-family firms are in the same stage.
As we can see in Table 1, there are indeed significant differences in the main characteristics between firms in start-up/growth stage and mature firms. These results justify an analysis on the differences in productivity between family and non-family firms across different firms’ stages.
|
Table 1 Comparison between start-up/growth and mature firms – selected variables. |
|||||
|
Start-up/growth Firms |
Mature Firms |
||||
|
Variable |
Mean |
Std. Dev. |
Mean |
Std. Dev. |
T-statistic |
|
lnAV |
11.578 |
1.404 |
12.431 |
1.682 |
-65.22* |
|
lnlabour |
2.114 |
1.079 |
2.824 |
1.296 |
-70.54* |
|
lncapital lnmaterials |
12.578 9.781 |
1.447 2.024 |
13.524 10.746 |
1.753 2.078 |
-69.89* -53.20* |
|
Total observations |
59405 |
15960 |
|||
Notes: T statistics: tests difference in means between start-up/growth and mature firms.
*Significant at 1% level
Table 2 presents some descriptive statistics for the main variables for both family and non-family firms and for firms in the two stages. Tests for differences in means between family and non-family firms reveal that the two types of firms are significantly different in all variables. Family firms present lower averages in Added Value and capital, as well as fewer employees than non-family firms and less capital. Family firms also show lower levels of intermediate inputs (lnmaterials).
The conclusion that family firms are smaller is consistent with previous studies on family business, such as Mannarino et al. (2011), Martikeinen et al. (2009) or Barbera and Moores (2013). In all variables, family firms show less dispersion than non-family firms.
|
Table 2. Family and Non-Family Firms: descriptive statistics and difference of means test - main variables |
|||||
|
|
Family Firms |
Non-Family Firms |
|
||
|
Variable |
Mean |
Std. Dev. |
Mean |
Std. Dev. |
T-statistic |
|
lnAV |
11.471 |
1.313 |
12.576 |
1.715 |
93.09* |
|
lnlabour |
2.050 |
1.022 |
2.877 |
1.321 |
89.86* |
|
lncapital |
12.468 |
1.324 |
13.664 |
1.840 |
97.51* |
|
lnmaterials |
9.691 |
1.946 |
10.824 |
2.196 |
67.72* |
|
Total observations |
55804 |
|
19561 |
||
|
Family Firms start-up / growth stage |
Non-Family Firms start-up/growth stage |
||||
|
Variable |
Mean |
Std. Dev. |
Mean |
Std. Dev. |
T-statistic |
|
lnAV |
11.368 |
0.006 |
12.315 |
0.014 |
71.07* |
|
lnlabour |
1.962 |
0.005 |
2.651 |
0.011 |
67.05* |
|
Incapital |
12.351 |
0.006 |
13.378 |
0.015 |
75.14* |
|
Inmaterials |
9.562 |
0.009 |
10.548 |
0.019 |
50.31* |
|
Total observations |
46254 |
13151 |
|||
|
Family Firms mature stage |
Non-Family Firms mature stage |
||||
|
Variable |
Mean |
Std. Dev. |
Mean |
Std. Dev. |
T-statistic |
|
lnAV |
11.973 |
0.015 |
13.113 |
0.022 |
44.50* |
|
lnlabour |
2.477 |
0.012 |
3.340 |
0.017 |
43.58* |
|
Incapital |
13.037 |
0.015 |
14.249 |
0.023 |
45.55* |
|
Inmaterials |
10.315 |
0.019 |
11.390 |
0.027 |
33.13* |
|
Total observations |
9550 |
|
6410 |
|
|
Notes: T statistics: tests difference in means between family and non-family firms.
*Significant at 1% level
Analysis of Results
Table 3 presents the coefficient estimates for the production function considering both homogeneity and heterogeneity of inputs, for all firms and also for start-up/growth stage firms and mature stage firms. All specifications include industry, year and regional controls, which are globally significant in explaining firm productivity. However, these are not reported due to the large number of coefficients.
Unlike previous studies, the possible bias of estimates due to correlation between input levels and unobserved productivity is explicitly considered, by using the Wooldridge (2009) approach. Indeed, tests confirm there is an endogeneity problem in all the specifications (see Table 3) and therefore OLS estimates are not consistent.
Analysing first all the firms’ stages together and homogeneity of inputs, we conclude that the elasticities’ estimates are very similar to other studies, such as Barth et al. (2005) and Barbera and Moores (2013), and we may reject the hypothesis of constant returns to scale. The possibility of differences in the coefficient inputs between family and non-family firms is considered by introducing two interactions between the dummy variable of family and each of the inputs in specification (2). The results show important differences in inputs between family and non-family firms. Indeed, for family firms capital seems to contribute less to total output while labour makes a larger contribution than for non-family firms. These findings are in line with the conclusions of Barbera and Moores (2013) about input differences between these two types of firms, and are also in accordance with our hypotheses H1 and H2.
To compare productivity performance between family and non-family firms, the key variable is the dummy family. Considering both homogeneity and heterogeneity of inputs, there is a negative but not significant coefficient for the family variable, which suggests that family firms are not more productive than non-family firms. Therefore, these results are according to previous findings of Barbera and Moores (2013) and confirm our hypothesis H3.
In order to study possible differences along the firms’ life cycle we estimate separate regressions for the two firms’ stages. Our findings suggest that there are no significant productivity differences between family firms and non-family firms for both start-up/growth stage and mature stage. Indeed, although the coefficient estimate of the family variable for mature firms is lower, the variable is always not significant. Hence, our results confirm our expectations that there are no differences in productivity between family firms and non-family firms for start-up/growth firms and therefore confirm hypothesis H4. However, these findings are not according to our predictions regarding firms in the mature stage. Our hypothesis H5 was that mature family firms display higher productivity than other type of firms of the same stage, which is not confirmed in this analysis. Regarding the inputs coefficients, the contribution of the labour factor follows the same pattern for both start-ups and mature firms. This pattern is not confirmed for the use of capital. In fact, there are significant differences in the use of capital between family and non-family mature firms, which does not occur for start-up/growth ones.
|
Table 3 Estimation Results – Wooldridge method. |
||||
|
All Firms |
Start-up/growth Stage |
Mature Stage |
||
|
(1) |
(2) |
(3) |
(4) |
|
|
Family |
-0. 007 (0.005) |
-0.686 (0.573) |
-0.263 (0.869) |
-2.429 (1.439) |
|
Lnlabour |
0. 788* (0.004) |
0. 738* (0.008) |
0.744* (0.010) |
0.753* (0.014) |
|
Lncapital |
0.356* (0.004) |
0. 379* (0.007) |
0.370* (0.025) |
0.397* (0.013) |
|
lnlabour*family |
---- |
0. 069* (0.009) |
0.056* (0.011) |
0.107* (0 .018) |
|
lncapital*family |
---- |
-0.033* (0.008) |
0.001 (0.028) |
-0.057* (0.018) |
|
Wald test (overall significance) |
177807.3* |
185244.3* |
126404.7 |
53267.05 |
|
Endogeneity Test |
39.66* |
62.36* |
52.40* |
16.09* |
|
Total Observations |
51077 |
51077 |
39469 |
11608 |
Notes: All specifications include yearly, regional and industry dummies, but are not reported.
(*), (**) - significant at 1% and 5 % level, respectively
Robust Standard Errors are in parenthesis.
These findings suggest that the characteristics of administration and human resource management practices remain constant over the life-cycle in both types of firm. Regarding the capital factor, important changes are found in mature stage family firms. This type of firms face a greater shortage of financial resources, greater risk aversion and a change in strategic orientation, which together contribute to a lower contribution of this factor. Moreover, in the case of family firms in Portugal, the labour factor determines their productivity and explains the fact that financing decisions and change in strategic orientation does not seem to affect their productivity, along their life-cycle.
It should be also mentioned that, besides endogeneity due to simultaneity between input choice and productivity shocks, other problems may occur when estimating production functions which might affect the results. Therefore, in order to check for the robustness of our results we have performed some other regressions5.
First, there is another possible source of endogeneity that comes from the fact that family ownership may be affected by firm performance, because families may only retain ownership of firms that perform better. Therefore, if family firms show higher productivity this may provide incentives for families to maintain control, and thus the analysis potentially suffers from an endogeneity problem. It is likely our conclusions are not too much affected by this possible problem,
as in the data almost all firms retain their ownership status over the years, which raises doubts about stronger performance causing family ownership. Other previous studies have also found that families keep firm ownership even in bad economic periods (e.g. Andres, 2008). Nevertheless, extra regressions were performed accounting for the possibility of ownership endogeneity, considering risk6 as an instrument for family ownership (following Demsetz and Lehn, 1985). The results showed that exogeneity of the family variable cannot be rejected and therefore the conclusions are not affected by ownership endogeneity. This finding is in accordance with previous studies that controlled for the endogeneity of ownership (Barbera and Moores, 2013 and Martikainen et al., 2009).
Second, besides endogeneity, there is the possibility of selection problems due to firm entry or exit in the period of analysis. Some methods have been proposed to deal with this problem (namely Olley and Pakes, 1996). However, authors such as Olley and Pakes (1996) and Levinsohn and Petrin (2003), have argued that in practice the gains in efficiency from taking this problem into account are not significant, especially when using unbalanced datasets (with both surviving and non-surviving firms). Accordingly, empirical studies have reported small differences in the coefficients after explicitly considering this problem (see for example Van Beveren, 2012). As in this study we consider an unbalanced data set, the results should not be too much affected by this problem. Yet we estimated the model considering a sample comprising only firms which survived over the entire period of analysis but the conclusions remained equal.
One other important aspect is the type of management in family firms, which may be an important factor in explaining the impact of family ownership on productivity. Some previous studies have analysed this aspect, such as Barth et al. (2005), and concluded that family-owned firms managed by someone hired outside the owning family show better productivity performance. Unfortunately, due to data limitations, it is not possible to study this aspect.
Conclusions
The literature suggests that ownership may influence firm performance. Although productivity is an important indicator of firms’ performance, not many studies have analysed this issue. This paper offers further evidence of the relationship between family ownership and productivity performance, considering the case of the manufacturing sector in Portugal. In particular, we test several hypotheses concerning the impact of ownership on productivity and on input factors contribution for production. First, this paper analyses if labour and capital factors contribute equally to production for both family and non-family owned firms, considering possible differences along the firms’ life-cycle stages. Second, this work investigates whether family owned firms display higher productivity than non-family firms and also if the impact of ownership differs along the firms’ life-cycle. Moreover, unlike previous studies, we take into account possible endogeneity problems due to simultaneity between input decision and productivity shocks.
The results reveal that the production technologies of family firms and non-family firms are different, especially concerning the contribution of labour. In family firms, labour makes a larger contribution to total output than in non-family firms for both start-up/growth stage and mature stage firms. As for capital, the results suggest that for firms in the mature stage it contributes less to output in the case of family firms than in non-family firms in the same stage, which does not occur for firms in start-up/growth stage. This result can be explained by changes in finance decisions and strategic orientation caused by efforts to keep control and solve conflicts among the family firms’ descendants.
Regarding the effects of family ownership on productivity, no significant differences in productivity between family and non-family firms are found for both startups and mature firms. These conclusions remain stable after performing several robustness checks. These findings confirm our conjecture that, for non-listed firms, no differences in productivity are expected between family and non-family firms for firms in startup / growth stage. However, they do not confirm our expectation that there should be a difference in productivity between family and non-family firms in the mature stage. This result is explained by the greater contribution of the labour factor and the lower contribution of capital in mature stage family firms. These two effects combined lead to no differences in productivity between the mature stage family firms and non-family firms in the same stage.
Summing up, we found no evidence of significant differences in productivity between family and non-family owned firms in the first two stages of a firms’ life cycle. We also confirmed the existence of different production technologies between family and non-family firms. In fact, results suggest that labour is the main contributing factor for productivity in family firms, which is especially notable for firms in the mature stage.
References
Ackerberg D, Benkard L, Berry S and Pakes A (2007). Econometric tools for analyzing market outcomes. In: Heckman J and Leamer E (eds) Handbook of Econometrics, vol. 6A. Amsterdam: North Holland, pp: 4171-4276.
Ackerberg D., Caves K. and Frazer G (2006). Structural identification of production functions. Munich Personal RePEc Achieve (MPRA Paper), 38349.
Ampenberger M, Schmid T, Achleitner A and Kaserer C. (2013). Capital structure decisions in family firms – empirical evidence from a bank-based economy. Review of Managerial Science, 7(3), 247-273.
Anderson D., Duru A. and Reeb D. (2012). Investment Policy in Family Controlled Firms. Journal of Banking and Finance, 36(6), 1744–1758.
Anderson R. and Reeb D. (2003). Founding family ownership and performance. Evidence from the S&P 500, Journal of Finance 58(3), 1301– 1327.
Ang J., Cole R. and Lin J. (2000). Agency Costs and Ownership Structure. The Journal of Finance 55(1), 81-106.
Arosa B., Iturralde T. and Maseda A. (2010). Ownership structure and firm performance in non-listed firms: Evidence from Spain. Journal of Family Business Strategy, 1(2), 88-96.
Azoury A., Daou L. and Sleiaty F. (2013). Employee engagement in family and non-family firms. International Strategic Management Review, 1(1-2), 11-29.
Banco de Portugal (2016). Análise sectorial das sociedades não financeiras em Portugal 2011-2016, Estudos da Central de Balanços 26.
Barbera F. and Moores K. (2013). Firm ownership and productivity: a study of family and non-family SMEs. Small Business Economics, 40(4), 953-976.
Barth E., Gulbrandsen T. and Schønea P. (2005). Family ownership and productivity: The role of owner-management. Journal of Corporate Finance, 11(1–2), 107–127.
Bassassini A., Breda, T., Caroli E. and Rebérioux A. (2013). Working in Family Firms: Paid Less But More Secure? Evidence from French Matched Employer-Employee Data. Industrial and Labor Relations Review, 66(2), 433-466.
Bennedsen M., Nielsen, K. , Pérez-González F., Wolfenzon D. (2007). Inside the family firm: the role of families in succession decisions and performance. Quarterly Journal of Economics, 122(2), 647–691.
Blanco-Mazagatos V., Quevedo-Puente E. and Castrillo L, (2007). The Trade-Off Between Financial Resources and Agency Costs in the Family Business: An Exploratory Study. Family Business Review, 20(3), 199-213.
Block J. H., Millán J. M., Román C. and Zhou H. (2013). Job satisfaction and wages of family employees. Entrepreneurship Theory and Practice, 39(2), 173-182.
Block J. (2012). R&D investments in family and founder firms: an agency perspective. Journal of Business Venturing, 27(2), 248–265.
Bosworth D. and Loundes J. (2002). The dynamic performance of Australian enterprises. Melbourne Institute of Applied Economic and Social Research. The University of Melbourne (Melbourne Institute Working Paper Series, Nº 3/02).
Brenes E. R., Madrigal K. and Requena B. (2011). Corporate governance and family performance, Journal of Business Research, 64(3), 280-285.
Chrisman J., Chua J. and Litz R. (2004). Comparing the agency cost of family and non-family firms. Entrepreneurship Theory and Practice, 28, 335–354.
Chrisman J., Steier L. and Chua J. (2008). Toward a theoretical basis for understanding the dynamics of strategic performance in family firms. Entrepreneurship Theory and Practice, 32(6), 935–947.
Coutts (2005). Family Business Survey: Are family businesses better prepared than other businesses to compete in the future?
Croci E., Doukas J., Gonenc, H. (2011). Family control and financing decisions. European Financial Management, 17(5), 860–897.
Cucculelli M. and Micucci G. (2008). Family succession and firm performance: Evidence from Italian family firms. Journal of Corporate Finance 14(1), 17-31.
Demsetz H. and Lehn K. (1985). The structure of corporate ownership: causes and consequences. Journal of Political Economy, 93(6), 1155–1177.
De Kok J. Uhlaner, L. and Thurik A. (2006). Professional HRM practices in family owned- managed enterprises. Journal of Small Business Management, 44(4), 441–460.
Dirección General de Política de la Pyme (DGPYME) (2003). Guía para la Pequeña y Mediana Empresa Familiar (Guide for the Small and Medium Family Business), Madrid.
Donckels R. and Lambrecht J. (1999). The Re-Emergence of Family-Based Enterprises in East Central Europe: What Can Be Learned From Family Business Research in the Western World? Family Business Review 12(2), 171-188.
Eddleston, K. and Kellermanns F. (2007). Destructive and productive family relationships, A stewardship theory perspective, Journal of Business Venturing, 22(4), 545-565.
European Commission (EC) (2015). Annual report on European SMEs 2014/2015. Available at: http://ec.europa.eu/growth/smes/business-friendly-environment/performance-review/index_en.htm.
Filbeck G. and Lee S. (2000). Financial Management Techniques in Family Businesses, Family Business Review, 13(3), 201-216.
Franks J., Mayer C., Volpin P and Wagner H. F. (2012). The Life Cycle of Family Ownership: International Evidence, The Review of Financial Studies, 25(6), 1675-1712.
Gersick K. E., Davis J. A., McCollom M. and Lansberg I. (1997). Generation to Generation: Life cycles of the Family Business. Boston, MA: Harvard Business School Press.
Gómez-Mejía L., Cruz C., Berrone P. and Castro J. (2011). The Bind That Ties: Socioemotional Wealth Preservation in Family Firms, The Academy of Management Annals, 5(1), 653-707.
Gómez-Mejía L., Takács H., Haynes K., Núnez-Nickel M., Jacobson K. and Moyano-Fuentes J. (2007). Socioemotional wealth and business risks in family-controlled firms: Evidence from Spanish olive oil mills, Administrative Science Quarterly, 52(1), 106–137.
Gómez-Mejía L, Nunez-Nickel M and Gutierrez I (2001). The Role of Family Ties in Agency Contracts. Academy of Management Journal, 44(1), 81-95
Górriz C. and Fumás V. (1996). Ownership structure and firm performance: some empirical evidence from Spain, Managerial and Decision Economics, 17(6), 575–586.
Habbershon T. and Williams M. (1999). A Resource-Based Framework for Assessing the Strategic Advantages of Family Firms, Family Business Review, 12(1), 1-22.
Habbershon T., Williams M. and MacMillan I. (2003). A unified systems perspective of family firm performance, Journal of Business Venturing, 18(4), 451-465.
Hand J. (2005). The value relevance of financial statements in the venture capital market, The Accounting Review, 80(2), 613-648.
Harris R. and Reid R. (2008). Barriers to Growth in Family-Owned Smaller Businesses. In R. Barrett and Mayson (Eds., International Handbook of HRM Entrepreneurship Edward Elgar.
Hiebl M. (2013). Risk aversion in family firms: what do we really know? The Journal of Risk Finance, 14(1), 49 – 70
Huang M., Li P., Meschke F. and Guthrie J. (2015). Family firms, employee satisfaction, and corporate performance, Journal of Corporate Finance, 34, 108-127.
King M. and Santor E. (2008). Family values: ownership structure, performance and capital structure of Canadian firms. Journal of Banking & Finance, 32(11), 2423-2432.
Kotey, B. and Folker, C. (2007). Employee training in SMEs: Effect of size and firm type— family and non-family, Journal of Small Business Management, 45(2), 214–238.
Le Breton-Miller I. and Miller D. (2009). Stewardship vs. Agency in public family firms: A social embeddedness reconciliation, A social embeddedness reconciliation. Entrepreneurship Theory & Practice, 33(6), 1169-1191.
James, H. S. (1999). Owner as manager, extended horizons and the family firm. International Journal of the Economics of Business, 6(1), 41-55.
Levinsohn J. and Petrin A. (2003). Estimating production functions using inputs to control for unobservables, Review of Economic Studies, 70(2), 317–341.
López – Gracia J and Sánchez – Andújar S (2007). Financial Structure of the Family Business: Evidence From a Group of Small Spanish Firms. Family Business Review, 20,269- 287.
Lumpkin G. and Dess G. (2001). Linking two dimensions of entrepreneurial orientation to firm performance: The moderating role of environment industry life cycle, Journal of Business Venturing, 16(5), 429–51.
Mandl. I (2008). Overview of family Business Relevant Issues, Final Report Contract Nº 30-CE-0164021/00-51. Austrian Institute for SME Research, Available from: http://www.pedz.uni-mannheim.de/daten/edz-h/gdb/08/familybusiness_study_en.pdf
Mannarino L., Pupo V. and Ricotta F. (2011). Family Involvement in Management and Firm Performance: Evidence from Italy. University of Calabria, Working Paper Nº 03.
Martikainen M., Nikkinen J. and Vahamaa S. (2009). Production functions and productivity of family firms: Evidence from the S&P 500, The Quarterly Review of Economics and Finance, 49(2), 295-307.
Martin, W. and Lumpkin, G. (2004). From entrepreneurial orientation to family orientation: Generational differences in the management of family businesses, Frontiers of entrepreneurship research. Wellesley, MA: Babson College.
McConaughy D. and Phillips G. (1999). Founders versus Descendants: The Profitability, Efficiency, Growth Characteristics and Financing in Large, Public, Founding Family-Controlled Firms, Family Business Review ,12(2), 123-132.
McConaughy D.L. (2000). Family CEO vs. nonfamily controlled firm: an examination of the level and sensitivity of pay to performance. Family Business Review, 13(2), 121-131.
Miller D., Le Breton-Miller I. and Lester R. (2013). Family firm governance, strategic conformity and performance, Organization Science, 24(1), 189–209.
Miller D., Le Breton-Miller I. and Scholnick B. (2008). Stewardship vs. Stagnation: An empirical comparison of small family and non-family business, Journal of Management Studies, 45(1), 51-78.
Miller, D. and Le Breton-Miller I. (2006). Family governance and firm performance: agency, stewardship and capabilities, Family Business Review 19(1), 73-87.
Miller, D., Steier L. and Le Breton-Miller I. (2003). Lost in time: Intergenerational succession change, and failure in family business, Journal of Business Venturing, 18(4), 513-531.
Molly V., Laveren E. and Jorissen A. (2012). Intergenerational differences in family firms: Impact on capital structure and growth behaviour, Entrepreneurship: Theory and Practice, 36(4), 703-725.
Molly V., Laveren E. and Deloof M. (2010). Family business succession and its impact on financial structure and performance, Family Business Review, 23(2), 131-147.
Morikawa M. (2013). Productivity and survival of family firms in Japan, Journal of Economics and Business 70, 111-125.
Morck R. and Yeung B. (2003). Agency problems in large family business groups. Entrepreneurship: Theory and Practice, 27(4), 367-382.
Munari F., Oriani M. and Sobrero R. (2010). The effects of owner identity and external governance systems on R&D investments: a study of Western European firms, Research Policy, 39(8), 1093–1104.
Olley G. S. and Pakes A. (1996). The dynamics of productivity in the telecommunications equipment industry, Econometrica, 64(6), 1263-1297.
Palia D. and Lichtenberg F. (1999). Managerial ownership and firm performance: A re-examination using productivity measurement, Journal of Corporate Finance, 5(4), 323–339.
Patel P. and Chrisman J. (2014). Risk abatement as a strategy for R&D investments in family firms, Strategic Management Journal, 35(4), 617-627
Pérez-Gonzalez F. (2007). Inherited Control and Firm Performance, American Economic Review, 96(5), 1559-1588.
Rocca M., Roca, T. and Cariola A. (2011). Capital Structure Decisions During a Firm’s Life Cycle, Small Business Economics, 37(1), 107–130.
Romano C., Tanewski G. and Smyrnios K. (2001). Capital structure decision making: A model for family business, Journal of Business Venturing, 16(3), 285-310.
Santarelli E. and Lotti D. (2005). The Survival of Family Firms: The Importance of Control and Family Ties, International Journal of the Economics of Business 12(2), 183-192.
Schmid T. (2013). Control considerations, creditor monitoring, and the capital structure of family firms. Journal of Banking and Finance, 37(2), 257-272.
Schulze W., Lubatkin M., Dino R. and Buchholtz A. (2001). Agency relationships in family firms: Theory and evidence. Organization Science, 12(2), 99-116.
Schulze W., Lubatkin M. and Dino R. (2003). Towards a theory of agency and altruism in family firms. Journal of Business Venturing, 18(4), 473-490.
Sirmon D. and Hitt M. (2003). Managing Resources: Linking Unique Resources, Management, and Wealth Creation in Family Firms. Entrepreneurship Theory and Practice, 27(4), 339-358.
Sridharan R. S. and Joshi M. (2016). Is Firm Performance and Corporate Governance Influenced by Ownership Patterns? – A Study with Reference to Firm Life Cycles, The IUP Journal of Accounting Research & Audit Practices, 15(2), 38-59.
Upton N. and Petty W. (2000). Venture capital investment and US family business, Venture Capital, 2(1), 27-39.
Van Beveren I. (2012). Total Factor Productivity Estimation: a Practical Review. Journal of Economic Surveys, 26(1), 98-128.
Villalonga B. and Amit R. (2006). How do family ownership, management and control affect firm value? Journal of Financial Economics, 80(2), 385–417.
Wooldridge, J.M. (2009). On estimating firm-level production functions using proxy variables to control for unobservables. Economics Letters, 104(3), 112–114.
Zellweger T. and Sieger P. (2012). Entrepreneurial orientation in long-lived family firms. Small Business Economics, 38(1), 67-84.
Notes
1. We have checked for the existence of outliers using several procedures. Only six observations were classified as possible outliers. However, we performed regressions with and without outliers and found no significant differences in the coefficient estimates. Therefore, we have considered all the observations in our analysis.
2. Several authors, such as Barth et al (2005) or Mannarino et al. (2011), have also considered the same measure for output.
3. Other proxies were also considered (sum of equity and total liabilities) but the conclusions were not affected.
4. Tobacco products were not included as no family firms are present in this sector.
5. These results are available upon request.
6. Following Maury (2006), the standard deviation of profit rate was employed as a measure of risk.