European Journal of Family Business (2022) 12, 1-17
The Performance of Family Firms During Crisis Periods:
The Case of Greece
Ioannis Kinias*
University of the Aegean, Chios, Greece
Research paper. Received: 2021-7-15; accepted: 2021-12-15
JEL CLASSIFICATION
G01
KEYWORDS
Family business performance, Ownership, CEO, Board of directors, Financial crisis
CÓDIGOS JEL
G01
PALABRAS CLAVE
CEO, Consejo de administración, Crisis financiera Desempeño de la empresa familiar, Propiedad
Abstract This paper examines the effect of the family involvement in the performance of Greek listed companies, during the Greek financial crisis. The involvement of family in firm’s ownership, management and governance along with the firm’s age constitute the unified framework that describe the family influence on the enterprise. The main contribution of this paper is the investigation of a research period when Greece faced an unprecedented economic 9 year crisis that affected all sectors of the economy, with 72% of listed companies showing a decrease in revenue and the total capitalization of the Greek Stock Exchange shrinking by 70%. No previous study has incorporated performance data on listed companies during a corresponding financial crisis with large fluctuations in all performance indicators and a high volatility in the national economy. The sample of the research includes 80 family firms listed in the Greek Stock Exchange. The findings illustrate a better performance for family firms with lower family ownership and prove a stronger performance in younger family businesses. The results of the study do not confirm the positive involvement of family members, through management (CEO) and governance (BoD) positions in the family business performance.
El rendimiento de las empresas familiares durante los períodos de crisis: El caso de Grecia
Resumen Este trabajo examina el efecto de la implicación familiar en los resultados de las empresas griegas que cotizan en bolsa, durante la crisis financiera griega. La participación de la familia en la propiedad, la gestión y el gobierno de la empresa, junto con la edad de la misma, constituyen el marco unificado que describe la influencia de la familia en la empresa. La principal contribución de este trabajo es la investigación de un periodo de investigación en el que Grecia se enfrentó a una crisis económica sin precedentes de nueve años que afectó a todos los sectores de la economía. Durante este período de crisis disminuyeron un 72% los ingresos de las empresas griegas cotizadas y la capitalización total de la Bolsa griega se redujo en un 70%. Ningún estudio anterior ha incorporado datos sobre el rendimiento de las empresas que cotizan en bolsa durante una crisis financiera correspondiente con grandes fluctuaciones en todos los indicadores de rendimiento y una gran volatilidad en la economía nacional. La muestra de la investigación incluye 80 empresas familiares que cotizan en la Bolsa griega. Los resultados ilustran un mejor rendimiento de las empresas familiares con menor propiedad familiar y demuestran un mayor rendimiento en las empresas familiares más jóvenes. Los resultados del estudio no confirman la implicación positiva de los miembros de la familia, a través de los puestos de dirección (CEO) y de gobierno (BoD) en el rendimiento de la empresa familiar.
https://10.24310/ejfbejfb.v12i1.13020
Copyright 2022: Ioannis Kinias
European Journal of Family Business is an open access journal published in Malaga by UMA Editorial. ISSN 2444-8788 ISSN-e 2444-877X
This work is licensed under a Creative Commons Atribution-NonCommercial-ShareAlike 4.0 International License (CC BY-NC-SA 4.0).
*Corresponding author:
E-mail: ikinias@ba.aegean.gr
1. Introduction
Businesses can be divided into family and non-family and there are many researches that connect some of their results to whether the company is family or not (Barbera & Moores, 2013; Chrisman et al., 2008; Wiener-Fererhofer, 2017). Many researchers are guided by a prime question: “How does the family contribute to the business and its success?”. To answer this question, the concept of familiness (Habberson & Williams, 1999; Habbershon et al., 2003) has developed to describe the particular internal resources that affect the family involvement in the enterprise. The concept of participation includes family involvement in ownership, management and governance (Chrisman et al., 2005). This is the basic prerequisite for a family to exert influence on the family business and this approach is sufficient to qualify a business as a family business (Pearson et al., 2008).
The impact of the ownership and management structure on the performance and development of the company is a subject to intense discussions (Anderson & Reeb, 2003; Barontini & Caprio, 2006; Sraer & Thesmar, 2007; Williams Jr, 2018; Williams Jr et al., 2019). Much of this discussion focused on studying the relationship between the family involvment in ownership, governance and management and the business performance (Danes et al, 2009; Sirmon & Hitt, 2003). These studies provide differentiated conclusions regarding the contribution of the family involvement in the business performance (Eddleston et al., 2012).
This study examines factors related to family influence on the performance of the Greek listed family firms. These include the dimensions of family ownership, family management and family governance, as well as the separate effect of business age. These factors constitute a unified framework of family influence on the company’s performance.
The research collects data for a sample of 80 listed family firms for the years 2005 – 2018, that covers two periods before and during the Greek financial crisis. This historically unique period started in 2010 when Greece signed its first MoU with its creditors (EC, ECB, IMF), includes the critical year 2015 when the referendum was held which essentially judged the country’s presence in the Euro and closed in 2018 when Greece completed its obligations in the third and final MoU with its creditors. The study contains financial (ROA), ownership, governance (board of directors) and management (CEO) data in order to examine the impact of the family effect in the business performance, in the unexplored field of the Greek listed family firms. An important asset of our research is the data. To the best of our knowledge, the sample, on its current form, is unique, since we manually gathered the data and it is not available elsewhere (payware or freeware database).
The main contribution of this research is the investigation of the business performance during a period when Greece faced an unprecedented economic 9 year crisis that affected all sectors of the economy, all forms of entrepreneurship and undoubtedly the life of the inhabitants as a whole. This econometric research included data for a period with large fluctuations in all performance indicators and high volatility for the Greek economy, which makes it unique compared to all other studies that have dealt with the performance of listed family businesses. No previous study has incorporated data on listed companies during a corresponding national financial crisis. The most important elements of the uniqueness of this crisis are two. First, the degree to which it affected companies, with 72% of listed companies showing a decrease in revenue and the total capitalization of the Greek Stock Exchange shrinking by 70%. The second is the time for which the crisis affected the national economy and consequently the listed companies, which approached 10 years. This volatile environment has led to large deviations in business performance, overturning important findings from previous researches on the impact of the family, particularly on family firm’s management and governance.
The paper is organized as follows. The next section reviews theory and sets the research hypotheses, while the third section presents the Greek context. The fourth section discuss our data from the Greek Stock Exchange and demonstrates the statistics and the fifth one discusses the findings. The sixth section presents implications, limitations and future research challenges and the final section concludes the paper.
2. Literature Review and Hypotheses Setting
Μost of the research that sought to investigate the effect of family on family business performance was based on two basic theories. The first and most common theory, known as agency theory, argues that the distinction between ownership and management in a business can lead to conflicts between shareholders and managers (Block et al., 2011; Dyer, 2006; Miller et al., 2007; Sciascia & Mazzola, 2008). Jensen and Meckling (1976) introduced the agency theory to explain these conflicting goals between shareholders and managers. The agency relationship is a contract under which a person hires another person to perform certain duties or services on behalf of the former, partly transferring the decision-making power. When the information is incomplete, the shareholder does not know exactly the actions of the manager. The problems of representation can then take on two dimensions: the bad choice, which refers to the missing skills and abilities of the manager, and the moral hazard, which refers to the manager’s lack of effort (Eisenhardt, 1989). Both dimensions create costs that are called agency costs (Jensen & Meckling, 1976).
Τhe second theory, which is increasingly found in the literature, known as stewardship theory, argues that managers do not always seek to accomplish their own individual goals but rather act as stewards of the business (Davis et al., 1997; Miller & Le Breton-Miller, 2006; Uhlaner et al., 2007).
In terms of stewardship theory, researchers have argued that a good steward in a family business takes care of the assets of a family that wants to pass on a healthier and stronger business to future generations (Davis et al., 2010). This could easily be identified as a determinant of superior family business performance and as a source of competitive advantage (Eddleston & Kellermanns, 2007; Miller et al., 2008).
However, it is generally accepted that wealth creation is not necessarily the sole or even the primary goal of all family businesses (Davis & Tagiuri, 1989; Sharma et al., 1997; Tagiuri & Davis, 1992). Miller and Le Breton-Miller (2006) describe that family owners and managers are often deeply concerned with ensuring business continuity or longevity and therefore invest in developing the business for the benefit of family members.
This ambition for longevity allows for the establishment of long-term relationships of trust with stakeholders (Tagiuri & Davis, 1996) and may aim to create a work environment with a strong belief in corporate culture that favors the emergence of talented groups of people.
2.1. Ownership and firm performance
Some researchers are exploring the agency theory and concluding that family ownership can maximize agency problems and negatively affect the firm performance (Barclay & Holderness, 1989; Gómez-Mejía et al., 2001; Morck et al., 2005; Schulze et al., 2003). On the other hand, a number of agency theory-driven studies conclude that family ownership can minimize agency problems and thus enhance performance and build shareholder value (Anderson & Reeb, 2003; Maury, 2006; San Martin-Reyna & Duran-Encalada, 2012). Other scholars prove that the strong involvement of family members in the ownership and management of family businesses leads to an alignment of interests (Fama & Jensen, 1983) and undoubtedly a reduction in conflict (Becker, 1974; Daily & Dollinger, 1992; Eisenhardt, 1989). Therefore, the majority of studies exploring the influence of family ownership on firm performance, according the agency theory, illustrates positive links between the two.
Stewardship theory has not been widely used to study the business performance in listed firms (Andres, 2008). However, studies that have already been conducted highlight the special characteristics of family businesses, such as the relationship of trust between family members and the strong commitment to its goals, which ultimately positively affect the business performance (Miller & Le Breton-Miller, 2006; Uhlaner et al., 2007).
Especially, regarding the relationship between the concentration of ownership and the performance in listed companies, some studies show a non-linear trend that varies depending on the percentage of ownership or voting rights held by the family (Anderson & Reeb, 2003; Sciascia & Mazzola, 2008). Maury (2006) also shows that the relationship is always positive, but it is extremely important only in a percentage of ownership higher than 30%.
On the other hand, the results for unlisted family companies are rather varied. Regarding unlisted companies, Sciascia and Mazzola (2008) argue that the relationship between family ownership concentration and profitability is positive but not significant. Similarly, in other studies, there does not appear to be a statistically significant correlation between family ownership and performance (Chrisman et al., 2004; Schulze et al., 2001; Sciascia & Mazzola, 2008; Westhead & Howorth, 2006).
There are many studies show that family ownership has a positive effect on the performance of a listed firm (Anderson & Reeb, 2003; Chu, 2009; Hamelin, 2013; Kowalewski et al., 2010; Lisboa, 2016; Maury, 2006; Pindado et al., 2008; San Martin-Reyna & Duran-Encalada, 2012; Schepers et al., 2014; Sciascia et al., 2012), while only few support the opposite conclusion (Filatotchev et al., 2005; McConaughy & Phillips, 1999; Miller et al., 2007).
Based on the so far conducted researches it is interesting to verify the following hypothesis:
Hypothesis 1. There is a positive relationship between family ownership and firm performance, for the Greek listed companies during the research period.
2.2. Firm age and firm performance
Referring to the age of family businesses, Anderson and Reeb (2003) found that they were established on average 76 years ago. Miller et al. (2007), in their own study also find that 31% of family businesses are still in their first generation and 69% in their second generation. Sraer and Thesmar (2007) argue that family businesses are younger when run by their founders, while those with descendants or professional managers are clearly older.
Researchers suggests that the firm age can affect the firm performance. Some of them have come to conclusion that the firm performance decreases as the business becomes older and when the ownership is transferred to the next generations (Anderson & Reeb, 2003; Block et al., 2011; Herrera-Madueño et al., 2011; Villalonga & Amit, 2006). They believe that the older family firm may not perform as well as their younger counterparts due to the loss of the long-term orientation or due to conflicts that may arise between members of the extended family. Other studies illustrates that younger family firms, are more likely to have a positive influence on firm performance compared to older firms (Anderson & Reeb, 2003; Villalonga & Amit, 2006).
Many researchers identify the importance of the successful succession as the one that guarantees the subsequent positive performance of the company, its sustainability, and the satisfaction of stakeholders with the process of succession (Le Breton‐Miller et al., 2004). The relationship between succession and performance in family businesses has also investigated in the literature (Cucculelli & Micucci, 2008). The results show that succession negatively affects performance, both in the case of a family member successor and a successor unrelated to the family. Thus, the existence of succession costs is reflected in both cases. It is observed that the reduction in performance after the succession is greater for companies where their management is undertaken by one person within the family, in contrast to the succession with a non-family member. This is explained by the trend of external executives to reorganize the structure of the company.
Based on the so far conducted researches it is interesting to verify the following hypothesis:
Hypothesis 2. The positive relationship between family ownership and performance is stronger in younger firms, for the Greek listed companies during the research period.
2.3. Family management and firm performance
Family members often hold senior management positions in family firms. The degree of family involvement in management, regardless of the roles that members play, varies according to studies between 33% (Maury, 2006) and 80% (Barontini & Caprio, 2006).
Many studies have explored the role that family members can play as CEOs (Morck et al., 1988; Peng & Jiang, 2010; Villalonga & Amit, 2006). In companies controlled by the founders, the founder is the CEO in 50% of cases, one of his descendants is in 11% of cases and the founder has a non-executive role in 39% of cases. The presence of professional CEOs is more frequent in the Anglo-Saxon countries, while in all countries it is found in later-than-first-generation family businesses.
A CEO with reference to the family has a greater commitment and a better knowledge of the firm because he has grown up close to its day-to-day operation (Bertrand & Schoar, 2006; Donnelley, 1988). In addition, when businesses succeed, CEOs from the family are rewarded not only with cash benefits but also with personal satisfaction (Davis et al., 1997).
Many empirical researches have been conducted concerning the influence of family management, through the CEO position, on firm performance, especially in large listed companies (Anderson & Reeb, 2004; Daily et al., 1998; Poutziouris et al., 2015). Some of them highlights the positive effect in the performance of listed firm when the founder acts as CEO (Anderson & Reeb, 2003; Block et al., 2011; McConaughy et al., 1998; Miller et al., 2007; Saito, 2008; Villalonga & Amit, 2006). Many others believe that listed family companies outperform non-family companies when a family member is a CEO (Andres, 2008; Barontini & Caprio, 2006; Maury, 2006; Sraer & Thesmar, 2007). According to other studies a family CEO can bring along a better performance through best practices in terms of governance and management (Andres, 2008), long-term orientation (Eddleston et al., 2012) and cohesive organizational cultures and non-bureaucratic forms of organization (Le Breton-Miller & Miller, 2009).
On the other hand, as suggested by Sciascia and Mazzola (2008), family involvement in management has a negative quadratic relationship with performance (U-shaped). According this view, the performance decreases as family involvement increases and that the decrease is more noticeable at higher levels of participation.
However, both positive and negative relationships are drawn regarding the relationship between the family involvement in management and the performance of listed firms, the majority of the studies highlight the positive effect of this relationship (Anderson & Reeb, 2003; Andres, 2008; Block et al., 2011; Villalonga & Amit, 2006).
Based on the so far conducted researches it is interesting to verify the following hypothesis:
Hypothesis 3. There is a positive relationship between firm performance and family involvement in management for the Greek listed companies during the research period.
2.4. Family overnance and firm performance
Many firms have been born as family firms and even today the same families continue to control their corporate governance. According to agency theory when ownership is concentrated in the hands of one or a few shareholders, who also take on management roles, more effective corporate governance processes can be created (Jensen & Meckling, 1976; Shleifer & Vishny, 1997).
Therefore, their board of directors (BoD) are almost exclusively made up of family members. The European Country Analysis by Barontini and Caprio (2006) shows that family members are absent from the BoD in only 15% of family businesses and one of them is the CEO in 35% of cases. The members of the founding family participate in the BoD in 55% of the cases and only in 18% of the cases the members of the founding family do not have executive roles. The presence of heirs on the board is still high, especially in non-executive roles, indicating their willingness to retain a controlling role in professional CEOs.
The corporate structure of the BoD and its impact on firm performance is one of the most discussed issues in the literature (Anderson & Reeb, 2004; Huse, 2000; Zahra & Pearce, 1989). A number of studies conclude that family control of the board leads to improved performance of the firm due to the minimization of conflicts between family members and external non-executive directors (Andres, 2008; Chu, 2011; Giovannini, 2010). In addition, the influence of family members on the BoD as non-executive members seems to be significantly positive in performance according to some studies (Barontini & Caprio, 2006; Lee, 2006) and at the same time insignificant according to others (Maury, 2006).
On the other hand, some studies (Anderson & Reeb, 2004; McKnight & Mira, 2003; Weisbach, 1988) found a positive and important relationship between the percentage of external directors and the value of the business. However, other studies (Agrawal & Knoeber, 1996; Baysinger & Butler, 1985; Giovannini, 2010) found a negative relationship between the percentage of external directors in the BoD and the performance of the firm, and some studies (Dalton et al., 1998; De Andres et al., 2005; Jackling & Johl, 2009) found no relationship between the two variables.
However, both positive and negative relationships are highlighted regarding the relationship between the family involvement in governance and the performance of listed firms, the majority of the studies highlight the positive effect of this relationship (Barontini & Caprio, 2006; Giovannini, 2010).
Based on the so far conducted researches it is interesting to verify the following hypothesis:
Hypothesis 4. There is a positive relationship between firm performance and family involvement in governance for the Greek listed companies during the research period.
3. The Greek Context
The upward growth rates that began in Greece in 1993, ended in 2007-2008. Greece then had the second highest average GDP growth rate in the European Union after Ireland. With the international financial crisis of 2007-2009, the Greek adventure begun. In 2008 the crisis had not yet been fully realized in the country since the decline in economic activity was only - 0.3%.
In 2009 the recession is growing in Greece, with exports collapsing and economic activity shrinking - 4.3%. The sharp decline continued until the end of 2013, when the overall decline in economic activity exceeded 26% and unemployment jumped to 28%.
The Greek economy entered a marginal phase of growth at the end of 2014 but the political changes in the country reversed again the data in 2015. The Greek crisis has two phases, with the first ending in 2013 and the second beginning in 2015.
On the Greek Stock Exchange, its capitalization shrank by 70% by 2016. Listed companies faced a huge loss of value in their corporate economy. More specifically, 72% of listed companies showed a decrease in revenue. On the first two years of the crisis (2008-2010) EBITDA showed a decrease of 29% and profit after tax by 200%, with total losses exceeding € 2.3 billion.
The crisis has created a “high cost of capital” environment. The decline in demand was large and quickly led companies to squeeze costs and reduce investment. Investment activity slowed significantly. At the same time, access to bank financing became more difficult and, in many cases, companies violated the terms of their loans, which led them either to an increase in borrowing costs or to a precarious position regarding the possibility of continuing their activities, with a corresponding burden on banks.
The decline in profitability was also affected by the new taxes introduced during the years of crisis. Thus, the lack of efficiency, combined with the financing problems by banks, led companies to looking for new credit mainly through their suppliers. The working capital of the companies decreased, while one in three listed companies had negative working capital.
The collapse of the profitability of listed companies, led them to reduce the number of their employees and in addition to reduce the total cost of their wages, resulting in a decrease in the average size of companies.
Of the 209 companies that remained on the Greek stock market during the crisis, only 32 companies showed systematic profits from 2008 to 2016. The main ones were the companies of the Top 10 of the stock market. From 2008 to 2018, only 2 of the 4 banks and 7 of the 10 non-financial enterprises maintained their position in the Top 10 of the capitalization of the Greek Stock Exchange.
4. Methodology, Data and Statistics
This research investigates the listed firms in the Greek Stock Exchange (GSE) and more specifically includes 80 family-controlled firms. Our sample concerns the listed companies, excluding financial firms, that have had a continuous and uninterrupted presence in the GSE for the fourteen-year period from 2005 to 2018. The data excludes also companies that have gone bankrupt, are closed or inactive and those which are into liquidation. The data cover a five-year period prior to the financial crisis (2005-2009) and a nine-year period during the crisis (2010-2018). The data concerns business and financial variables of the listed firms.
The first set of data refers to the family’s participation in the ownership of the business. To be considered a firm as family business, at least 10% of its shareholding must be in the hands of a family (Maury, 2006; Peng & Jiang, 2010; Pindado et al., 2008; Villalonga & Amit, 2006). According to other definitions this percentage could be either 30% (Barnes & Hershon, 1976) or 50% (Donckels & Fröhlich, 1991). For this reason we define three different classes (10% < S1 < 30%, 30% < S2 < 50%, S3 > 50%) in order to categorize family businesses according to the degree of involvement of a family in their shareholder composition.
The second set of data refers to the family involvement in the firm’s management through the presence of a family CEO, as well as in the firm’s governance through the family representation in the BoD (Anderson & Reeb, 2003). We conclude the participation of family members by the surname of the shareholders, the CEO and the members of the BoD, as in the previous studies of Villalonga and Amit (2006). Regarding the presence of family members in the BoD, we formed four groups BoD = 1, BoD = 2, BoD = 3 and BoD > 3 that describe the number of family members participating in the BoD of the family firm.
Additional variables that are analyzed were the size (Poutziouris et al., 2015) and the age (García-Ramos & García-Olalla, 2011) of the company. Especially for the size we define four separate categories, according the number of employees, in order to classify the firms, one for smaller ones (S < 50), one for medium (50 < M < 250), one for large (250 < L1 < 1000), and one for extra large businesses (L2 > 1000). Regarding the age, we define three separate categories, according the age of the family firm, one for younger ones (A1 < 30 years), one for medium aged (30 years < A2 < 70 years), and one for older firms (A3 > 70 years).
Concenring the measurement of the firm performance, our research includes data for the ROA index, in line with previous studies (Anderson & Reeb, 2003; Poutziouris et al., 2015). Table 1 offers a description of the dependent and independent variables that our study employs.
|
Table 1. Research variables |
|
|
Variable |
Description |
|
Dependent |
|
|
ROA (%) |
Firm’s performance measure |
|
Independent |
|
|
Family ownership (%) |
Family ownership is classified into three subcategories: Family Shareholding 10% < S1 < 30% 30% < S2 < 50% S3 > 50% |
|
Family board representation (BoD) |
Four subcategories for the number of family members participating in the BoD. BoD = 1 BoD = 2 BoD = 3 BoD > 3 |
|
Family Executive (CEO) |
The presence of a family member in the CEO position. |
|
Size (Number of Employees) |
Family firm size is classified into four subcategories: Small firms S < 50 Medium firms 50 < M < 250 Large firms 250 < L1 < 1000 Extra large firms L2 > 1000 |
|
Age |
Family firm age is classified into three subcategories: A1 < 30 years 30 years < A2 < 70 years A3 > 70 years |
The data collected and on which the results of the research are based concerns all family-owned companies listed on the GSE and includes the degree of the family ownership, the number of the family members in the BoD, the presence of a family member in the position of CEO, the age of the enterprises and the number of their employees.1
Table 2 presents descriptive statistics for these family firms concerning the above mentioned variables. Concerning the ownership rate of the family and the average number of employees, we see that as the family ownership increases, the number of employees decreases. This leads us to the conclusion that, in the larger companies, the families give up their business shares while, on the contrary, the smaller family-owned enterprises, maintain a greater degree of family character. Regarding the average number of family members in the BoD in family businesses, we see that as the ownership rate of the family increases, more family members participate in the BoD. As for the family or non-family status of the company’s CEO, it becomes clear that the majority of family firms maintains a family member as chief executive officer.
|
Table 2. Family business descriptive statistics |
|||||
|
Ownership (Share of capital - Si%) |
Family Business Population |
Size (Mean of number of employees) |
Governance (Mean of family members in the BoD) |
||
|
S3 > 50% |
52 (65%) |
404 |
2.58 |
||
|
30% < S2 < 50% |
21 (26.65%) |
1091 |
2.57 |
||
|
10% < S1 < 30% |
7 (8.75%) |
2850 |
2.14 |
||
|
Age (Categories of firm’s age - Ai) |
Size (Categories of number of employees) |
||||
|
A1 < 30 years |
10 (12.5%) |
L1 > 1000 |
19 (23.75%) |
||
|
30 years < A2 < 70 years |
54 (67.5%) |
250 < L2 < 1000 |
19 (23.75%) |
||
|
A3 > 70 years |
16 (20%) |
50 < M < 250 |
37 (46.25%) |
||
|
S < 50 |
5 (6.25%) |
||||
|
Management (CEO) |
|||||
|
Family member |
47 (58.75%) |
Non family member |
33 (41.25%) |
||
Regarding the methodology, two statistical methods are used to evaluate the research data and to draw robust and safe conclusions to check the degree of influence of the independent research variables on the dependent.
The first method is the one-factor ANOVA variance analysis with independent samples which check whether two or more groups of observations have very different means. The different datasets correspond to the independent variable and the observations correspond to the dependent variable. A statistically significant ANOVA analysis proves that the independent variable affects the dependent. In this research, the dependent variable according to Table 2 is the Financial Performance (ROA) and independent variables that will be tested by the ANOVA method are the Family Ownership (Si), the Firm Age (Ai) and the number of family members participating in the BoD of the company (BoDi). The datasets created are independent since the companies belong to only one i group at a time.
The second method is the t-test for independent samples used to estimate the statistical significance of the difference between the means of two sets of observations. This test is performed when the two sets of observations come from two different samples. Statistical significance is calculated using the variability of available data to estimate possible differences in the means of the two samples. According to null hypothesis there is no significant difference. In this study, the dependent variable again according to Table 2 is the Financial Performance ROA and an independent variable that will be tested by the t-test method is the presence of a family member in the position of CEO.
Prerequisite for the use of both ANOVA analysis and t-test is the normality test of the data. With this test we check whether our data follows a normal distribution to proceed to the next methodologies. In this research the normality test was performed and proved the normal distribution of the data with similar results for the Mean, Median, Kurtosis and Skewness.
An additional condition for the application of the t-test is the control for the differentiation of the data variances. The F-test for the equality of two variances was applied in order to decide whether the variances of the data sets in each case are equal or not.
5. Findings
This paragraph presents the results of the analysis carried out on the financial performance data, correlated with the variables of ownership (Si), age (Ai), family members in BoD (BoDi) and family members in CEO position, for the above mentioned family firms.
Table 3 shows the means of the economic indicators (ROA) correlated with the degree of the family participation in the shareholder composition of the company, as defined in the variable Si (S1, S2, S3) of Table 2. We check whether the groups of observations have very different means, by applying an one-factor ANOVA variance analysis with independent samples. A statistically significant ANOVA analysis proves that the independent variable affects the dependent variable. According to the results, the average ROA values for family businesses with lower family shareholding in the ownership of business S1 (5.148) is higher than those for businesses with higher family ownership S2 (2.289) and S3 (2.456). In addition, evaluating the p-value which is 0.046 (p < 0.05) results in a statistically significant difference between the three groups. Therefore, the conclusion that the family firms with lower family ownership (S1) have better financial performance than the firms in the groups with higher family ownership (S2 and S3) can be supported. Another result is the non-linear trend of the performance that varies depending on the percentage of ownership held by the family, that confirms the conclusion of previous studies (Anderson & Reeb, 2003; Sciascia & Mazzola, 2008).
The Figure 1 also confirms the outcome of the statistical analysis. The group S1 with the lowest family ownership performs better compared with the other two group of companies S2 and S3, for the whole research period (2005-2018). Therefore, these findings do not support the hypothesized positive relationship between family ownership and firm performance of the hypothesis 1. These findings verify prior researches (Filatotchev et al., 2005; McConaughy & Phillips, 1999; Miller et al., 2007) that concluded better performance for family firms with lower family ownership.
|
Table 3. Financial performance (ROA) - Family ownership (Si) |
||||||
|
Anova: Single factor |
||||||
|
Summary |
||||||
|
Groups |
Count |
Sum |
Average |
Variance |
||
|
10% < S1 < 30% |
14 |
72.08 |
5.148571 |
14.03249 |
||
|
30% < S2 < 50% |
14 |
32.05 |
2.289286 |
16.99828 |
||
|
S3 > 50% |
14 |
34.39 |
2.456429 |
3.904055 |
||
|
ANOVA |
||||||
|
Source of variation |
SS |
df |
MS |
F |
P-value |
F crit |
|
Between groups |
72.10506 |
2 |
36.05253 |
3.095982 |
0.046502 |
3.238096 |
|
Within groups |
454.1528 |
39 |
11.64494 |
|||
|
Total |
526.2578 |
41 |
|
|
|
|
|
Notes: Df = Degrees of freedom; F = F ratio = MS between groups/MS within groups; MS = Mean square; SS = Sum of squares P-value is the probability of observing a result (F critical) as big as the one which is obtained in the experiment (F0), assuming the null hypothesis is true. F crit = F critical is the value of the F-statistic at the threshold probability α of mistakenly rejecting a true null hypothesis. |
||||||
Figure 1. Financial performance (ROA) - Family ownership (Si)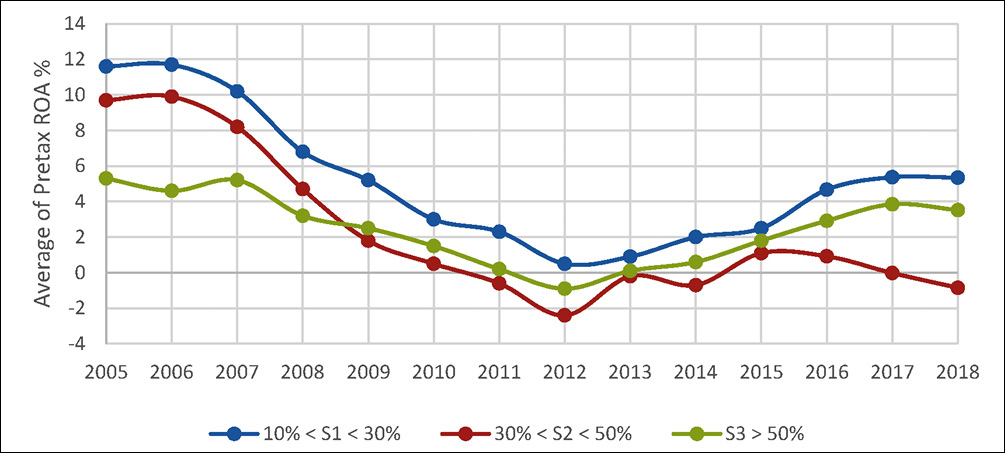
The age of the family firm is the next variable that was investigated on its effect on the business performance. Table 2, presents the three distinct categories (Α1 < 30 years, 30 years < Α2 < 70 years, Α3 > 70 years) created regarding the age of the family businesses included in the survey. We applied one-factor ANOVA variance analysis with independent samples checking whether that the independent variable Ai affects the dependent variable ROA.
According to the results of Table 4, the mean ROA values for younger family businesses A1 (4.36) is higher than those for older enterprises A2 (2.77) and A3 (1.13). In addition, evaluating the p-value which is 0.047 (p < 0.05) results in a statistically significant difference between the three groups. Therefore, the conclusion that the younger companies of group A1, with age lower than 30 years, have better financial performance than the respective companies of the groups A2 and A3 with age bigger than 30 or 70 years can be supported.
|
Table 4. Financial performance (ROA) - Firm age (Ai) |
||||||
|
Anova: Single factor |
||||||
|
SUMMARY |
||||||
|
Groups |
Count |
Sum |
Average |
Variance |
||
|
14 |
61.07 |
4.362143 |
22.21259 |
|||
|
30 < A2 < 70 |
14 |
38.75 |
2.767857 |
4.32848 |
||
|
A3 > 70 |
14 |
15.79 |
1.127857 |
9.284541 |
||
|
ANOVA |
||||||
|
Source of variation |
SS |
df |
MS |
F |
P-value |
F crit |
|
Between groups |
73.2291 |
2 |
36.61455 |
3.066065 |
0.047981 |
3.238096 |
|
Within groups |
465.7329 |
39 |
11.94187 |
|||
|
Total |
538.962 |
41 |
|
|
|
|
|
Notes: Df = Degrees of freedom; F = F ratio = MS between groups/MS within groups; MS = Mean square; SS = Sum of squares. P-value is the probability of observing a result (F critical) as big as the one which is obtained in the experiment (F0), assuming the null hypothesis is true. F crit = F critical is the value of the F-statistic at the threshold probability α of mistakenly rejecting a true null hypothesis. |
||||||
The Figure 2 confirms the results of the statistical analysis. The group A1 with the younger family firms performs better compared with the other two group of companies A2 and A3, almost the whole research period (2005-2018). These firms show better behavior and resilience compared to the other two categories.We can only detect some fluctuations in crucial moments for the economy of the country. Therefore, these findings can support the hypothesized positive relationship between the family company’s age and the firm performance of the Hypothesis 2. These outcomes support the conclusion of other studies that family firms’ performance is positively associated when the business is still in the first generation (Anderson & Reeb, 2003; Cucculelli & Micucci, 2008; Villalonga & Amit, 2006).
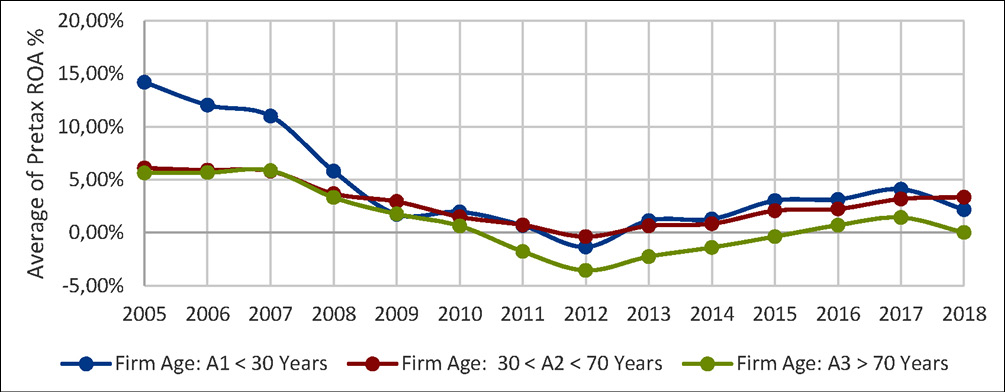
Figure 2. Financial performance (ROA) - Firm age (Ai)
The variable controlled by the Hypothesis 3 is the presence of a family member in the CEO role. Table 5 presents the means of financial ratio ROA for the listed family businesses, with the CEO either coming from or not coming from the family. We apply a T-test to investigate the statistical significance between the data of the two groups. Before that, we perform a two-sample F-test to know if the two groups have equal variance before performing the T-test. The analysis proves a p-value < 0.05 in the F-test and therefore we proceed to perform the T-test assuming that the two populations have unequal variances.
According to the results of Table 5, the mean ROA values for family CEO (2.85) is higher than the corresponding one for non family CEO (2.164). Nevertheless, evaluating the value of the p-value for two tail test, which is 0.533 (p > 0.05), results in a non-statistically significant difference between the two groups. Therefore, the hypothesis that companies with a family member in the position of CEO have better performance than the corresponding companies with a non-family member in the position of CEO can not be supported.
The study of the Figure 3 confirms this outcome. There is not a clear behavior of the family performance correlated with the family character of the CEO. In the period before 2009 business with non family CEO performs better and the results are the opposites after 2009. This view for this second period which is the period of financial crisis could be in line with previous studies that stress the positive links between founder involvement and profitability (Anderson & Reeb, 2003; Block et al., 2011; Villalonga & Amit, 2006). However, any such conclusion can not be supported from the statistical analysis.
Therefore, the positive relationship between firm performance and family involvement in management, through the CEO position that described in the Hypothesis 3, can not be confirmed by the research outcomes.
The next research variable refers to the number of family members participating in the BoD of the family firm. For the needs of this analysis we formed four groups of companies (BoD1, BoD2, BoD3 and BoD > 3) regarding the number of family members participating in the BoD of the firm, as described in Table 2. Table 6 presents the mean of the financial indicators ROA for these four categories.
We applied one-factor ANOVA variance analysis with independent samples checking whether that the independent variable BoDi affects the dependent variable ROA. The results of Table 6 show the average ROA values for family businesses with BoD1 (3.22), BoD2 (1.89), BoD3 (3.44), BoD > 3 (1.64). Evaluating the p-value which is 0.176 (p > 0.05) results in a non-statistically significant difference between the four groups. Therefore, the conclusion that family businesses with bigger
|
Table 5. Financial performance (ROA) - Family CEO |
||
|
F-Test two-sample for variances |
||
|
|
Non family CEO |
Family CEO |
|
Mean |
2.164285714 |
2.850714286 |
|
Variance |
12.72247253 |
3.693314835 |
|
Observations |
14 |
14 |
|
df |
13 |
13 |
|
F |
3.444730031 |
|
|
P (F < = f) one-tail |
0.016822054 |
|
|
F Critical one-tail |
2.576927084 |
|
|
T-Test: Two-sample assuming unequal variances |
|||
|
|
Non family CEO |
Family CEO |
|
|
Mean |
2.164285714 |
2.850714286 |
|
|
Variance |
12.72247253 |
3.693314835 |
|
|
Observations |
14 |
14 |
|
|
Hypothesized mean difference |
0 |
||
|
df |
20 |
||
|
t Stat |
-0.633911325 |
||
|
P (T < = t) one-tail |
0.266661199 |
||
|
t Critical one-tail |
1.724718243 |
||
|
P (T < = t) two-tail |
0.533322398 |
||
|
t Critical two-tail |
2.085963447 |
|
|
|
Notes: Df = Degrees of freedom; F = F ratio = MS between groups/MS within groups P-value is the probability of observing a result (F critical) as big as the one which is obtained in the experiment (F0), assuming the null hypothesis is true. F crit = F critical is the value of the F-statistic at the threshold probability α of mistakenly rejecting a true null hypothesis. t – value = measures the size of the difference relative to the variation in the sample data. |
|||

Figure 3. Financial performance (ROA) - Family CEO
participation of family members in their boards of directors (BoD3, BoD > 3) can perform better than those with lower presence of family members (BoD1, BoD2) cannot be supported.
The findings cannot confirm a significant correlation between the family participation in the BoD and the firm performance ROA. The Figure 4 confirms this confused picture regarding the financial performance of the four categories. Therefore, it is not possible to connect the participation of family members in the BoD with the more efficient governance of the company and consequently its better financial outcomes. So, it cannot be substantiated the positive relationship between firm performance and family involvement through the presence of family members in the BoD, that is described in Hypothesis 4.
|
Table 6. Financial performance (ROA) - Family members in BoD (BoDi) |
||||||
|
Anova: Single factor |
||||||
|
SUMMARY |
||||||
|
Groups |
Count |
Sum |
Average |
Variance |
||
|
Family members in BoD = 1 |
14 |
45.14 |
3.224286 |
8.846457 |
||
|
Family members in BoD = 2 |
14 |
26.51 |
1.893571 |
8.077517 |
||
|
Family members in BoD = 3 |
14 |
48.17 |
3.440714 |
7.307438 |
||
|
Family members in BoD > 3 |
14 |
23.04 |
1.645714 |
3.043873 |
||
|
ANOVA |
||||||
|
Source of variation |
SS |
df |
MS |
F |
P-value |
F crit |
|
Between groups |
34.95324 |
3 |
11.65108 |
1.708665 |
0.176614 |
2.7826 |
|
Within groups |
354.5787 |
52 |
6.818821 |
|||
|
Total |
389.5319 |
55 |
|
|
|
|
|
Notes: Df = Degrees of freedom; F = F ratio = MS between groups/MS within groups; MS = Mean square; SS = Sum of squares P-value is the probability of observing a result (F critical) as big as the one which is obtained in the experiment (F0), assuming the null hypothesis is true. F crit = F critical is the value of the F-statistic at the threshold probability α of mistakenly rejecting a true null hypothesis. |
||||||
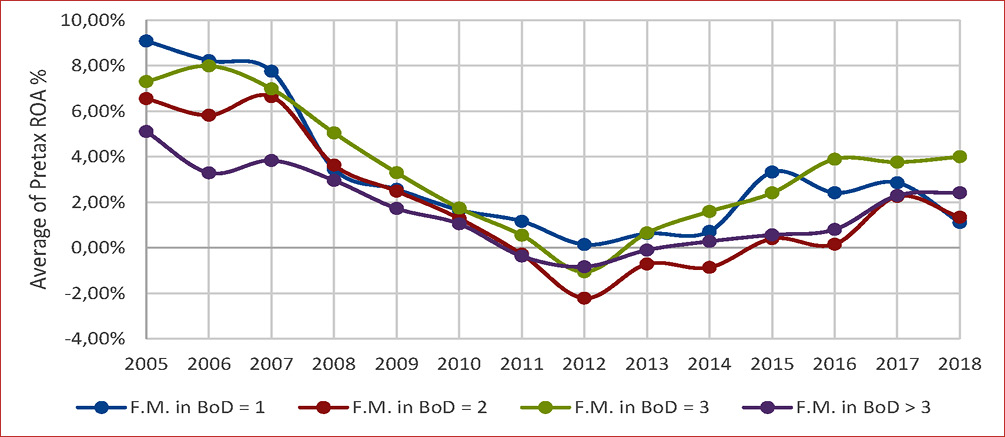
Figure 4. Financial performance (ROA) - Family members in BoD (BoDi). F.M.: Family members
6. Policy Implications, Limitations, and Future Research
The research investigated the impact of family involvement on the firm’s performance during unique times for the Greek society and economy. Τhe 14 year research period includes the economic crisis in Greece and some important facts as the referendum for the country’s presence in Euro as well as the banks’ capital controls.
The crisis created conditions of uncertainty affecting the performance of all the listed firms. Τhe fluctuation of business performance grew as political and economic conditions constantly changed. The contribution of the study is the highlighting of crisis conditions that can overturn a normality environment and therefore normal business behaviors.
The research proves that the companies with the lowest family ownership performs better compared with others with bigger involvement of the family in the sharehold of the enterprise. The positive relationship between family ownership and firm performance is not verified by the research. In addition, the better performance of the younger family businesses compared to all the others is also confirmed. Both these results reinforce the conclusions of previous studies (Anderson & Reeb, 2003; Barontini & Caprio, 2006; Filatotchev et al., 2005; McConaughy & Phillips, 1999; Miller et al., 2007; Poutziouris et al., 2015; Sraer & Thesmar, 2007; Villalonga & Amit, 2006).
Regarding the degree of family involvement in the firm’s management (CEO position) and its effect on firm’s performance, the findings cannot verify the conclusion of similar studies (Anderson & Reeb, 2003; Laffranchini & Braun, 2014; Miller et al., 2007; Poutziouris et al., 2015; Salerno, 2019; Villalonga & Amit, 2006). As for the family participation in the governance and its effect on the firm’s performance, the results show a confusing picture and there is no clear trend to confirm the findings of previous research. Therefore, we cannot prove that the involvement of more family members other than the founder in the BoD can improve the performance of the firm. The volatile environment with the large fluctuation in the performance index, during the crisis period, affected the findings providing an alternative perspective on the usual results concerning the relationship between family involvement and performance, that investigated in Hypotheses 3 and 4.
The research is not free from limitations. A first limitation concerns the sample of the business. The sample included only companies that had a continuous and uninterrupted presence in the stock exchange market during the research period. These companies were the ones that survived the conditions of the unprecedented crisis, and the sample is missing those companies that suspended their participation in the stock market for any reason. Another one was the absence of all the enterprises of the financial system (banks) and insurance companies that were individually affected by this crisis. In a similar study for another type of crisis, such as the pandemic crisis of Covid, these enterprises could be considered.
A next issue regards what we define as family involvement in the business. In the present study we defined the concept of involvement through participation in the ownership, management and governance of the organization. This definition can be extended to other concepts by expanding the aspect of family power and influence. Also, the number of family members participating in the company’s BoD does not give a clear result for the percentage of family members in relation to non-family members and the power relationship that the family holds in the firm’s governance. There is also no data on who owns the remaining share capital of the companies and whether they are small shareholders or other powerful organizations. Family business researchers have focused primarily on the relationship between owners and managers and secondarily between majority and minority shareholders (Chrisman et al., 2005).
Finally, another limitation concerns the choice of the country and the specific circumstances. Greece faced an economic crisis at the same time as other European countries such as Portugal and Ireland faced similar crises and turned to the same international organizations for support. Nevertheless, the elements of each economy are unique, as were the political decisions and solutions given for each case. The unique data of the environment therefore affected the listed companies of each country in a different way. Comparing and contrasting results may therefore not be so easy. To address this difficulty, not only economic but also non-economic variables could be used to measure performance so that the results are more easily comparable with those of other countries.
For the future research, family involvement is a dimension that could be studied with additional variables. The roles of family members in the organization, the generation of the family that dominates the business, the influence of the founder and the number of successors participating in the new era can give a more complete picture of the relationships and the overall family’s influence.
Another dimension that could be further analyzed in terms of the financial performance of the organization is its internal processes. Operational framework, regulations, management professionalism, human resource composition and organizational culture are some variables that can affect performance and it is important that they can be measured.
The way we determine performance can also be crucial. Performance can not only be financial but can be determined in terms of added value created by the organization. Therefore, the addition of non-economic variables that will evaluate the efficiency and performance of the family business will be able to give even more reliable conclusions.
An important parameter for further research is also the type of companies and their specific characteristics. Differences according to the sectoral environment of the company or its multinational activity could give additional interesting conclusions.
Finally, the type of crisis and its specific characteristics could also be a point of differentiation for future research. The Covid pandemic for example is shaping a new global crisis in which it would be useful to study the differentiation of the performance of listed family businesses and compare the results with those of other countries.
All these suggestions can potentially contribute to a more dynamic understanding of the influence that the family has on the performance of the firm.
7. Conclusion
This research examined the impact of family involvement on the Greek listed family firm’s performance, during a 14 years period. Τhe research period covers five years before the onset of the economic crisis in Greece and its 9 years duration.
Our study contributes to the literature by providing data that help to assess the influence of the family on the performance of listed family businesses in a period of unprecedented economic crisis of the national economy. The correlation of family influence in ownership, management, and governance with the performance of a business has been studied in the past with both positive and negative sign.
What is unique about the survey is that it includes data from listed companies at a time when overall performance has plummeted, their financial results have collapsed, and their internal procedures have been redefined.
The results do not confirm the fact that the financial performance of listed firms is positively affected by the participation of the founding family in their shareholder structure. These findings verify prior researches that present the negative links between family ownership and listed firm performance (Filatotchev et al., 2005; McConaughy & Phillips, 1999; Miller et al., 2007).
Performance is proving stronger in younger family businesses. These results are consistent with previous research (Anderson & Reeb, 2003; Barontini & Caprio, 2006; Miller et al., 2007; Sraer & Thesmar, 2007; Villalonga & Amit, 2006). Indeed, newer family businesses are characterized by a business dynamic or a different entrepreneurial orientation that can justify better performance.
At the next level the research investigated the involvement of family members in the management (CEO) and governance (BoD) of the family business and their effect on the performance of the organization. The results of the study contrast with similar studies in the literature and cannot confirm the findings of the previous researches regarding the positive influence of family members (through a family member CEO, representation on the board with its members) on the performance of the company (Anderson & Reeb, 2003; Cucculelli & Micucci, 2008; McConaughy et al., 1998; Miller et al., 2007; Villalonga & Amit, 2006).
While other studies suggest that family influence leads to higher returns, our findings cannot statistically confirm this result. A key element of the research is the large fluctuation in the performance indices during the crisis period. These fluctuations, because of the general volatility of the economic environment, form large standard deviations of the variables. This condition makes it difficult to statistically confirm the research hypothesis.
These findings are particularly important as they provide an alternative perspective on the usual results and demonstrate that a single state condition can reverse the decades-long relationship between family involvement and performance.
References
Agrawal, A., & Knoeber, C. R. (1996). Firm performance and mechanisms to control agency problems between managers and shareholders. Journal of Financial and Quantitative Analysis, 31(3), 337-398. https://doi.org/10.2307/2331397
Anderson, R. C., & Reeb, D. M. (2003). Founding-family ownership and firm perfor-mance: evidence from the S&P 500. Journal of Finance, 58(3), 1301–1327. https://doi.org/10.1111/1540-6261.00567
Anderson, R. C., & Reeb, D. M. (2004). Board composition: balancing family influence in S&P 500 firms. Administrative Science Quarterly, 49(2), 209-237. https://doi.org/10.2307/4131472
Andres, C. (2008). Large shareholders and firm performance. An empirical examination of founding-family ownership. Journal of Corporate Finance, 14(4), 431–445. https://doi.org/10.1016/j.jcorpfin.2008.05.003
Barbera, F., & Moores, K. (2013). Firm ownership and productivity: a study of family and non-family SMEs. Small Bussiness Economics, 40, 953–976. https://doi.org/10.1007/s11187-011-9405-9
Barclay, M. J., & Holderness, C. G. (1989). Private benefits from control of public corporations. Journal of Financial Economics, 25(2), 371–395. https://doi.org/10.1016/0304-405X(89)90088-3
Barnes, L. B., & Hershon, S. A. (1976). Transferring power in the family business. Harvard Business Review, 54(4), 105-114.
Barontini, R., & Caprio, L. (2006). The effect of family control on firm value and performance: evidence from continental Europe. European Financial Management, 12(5), 689–723. https://doi.org/10.1111/j.1468-036X.2006.00273.x
Baysinger, B., & Butler, H. N. (1985). Corporate governance and the board of directors: performance effects of changes in board composition. Journal of Law, Economics, and Organizations, 1(1), 101- 24. https://doi.org/10.1093/oxfordjournals.jleo.a036883
Becker, G. S. (1974). A theory of social interactions. Journal of Political Economy, 82(6), 1063–1093. https://doi.org/10.1086/260265
Bertrand, M., & Schoar, A. (2006). The role of family in family firms. Journal of Economic Perspectives, 20(2), 73-96. https://doi.org/10.1257/jep.20.2.73
Block, J. H., Jaskiewicz, P., & Miller, D. (2011). Ownership versus management effects on performance in family and founder companies: a Bayesian reconciliation. Journal of Family Business Strategy, 2(4), 232–245. https://doi.org/10.1016/j.jfbs.2011.10.001
Chrisman, J. J., Chua, J. H., & Litz, R. A. (2004). Comparing the agency costs of family and non–family firms: conceptual issues and exploratory evidence. Entrepreneurship Theory and Practice, 28(4), 335-354. https://doi.org/10.1111/j.1540-6520.2004.00049.x
Chrisman, J. J., Chua, J. H., & Sharma, P. (2005). Trends and directions in the development of a strategic management theory of the family firm. Entrepreneurship Theory and Practice, 29(5), 555-576. https://doi.org/10.1111/j.1540-6520.2005.00098.x
Chrisman, J. J., Steier, L. P., & Chua, J. H. (2008). Toward a theoritical basis for understanding the dynamics of strategic performance in family firms. Entrepreneurship Theory and Practice, 32(6), 935-947. https://doi.org/10.1111/j.1540-6520.2008.00264.x
Chu, W. (2009). The influence of family ownership on SME performance: evidence from public firms in Taiwan. Small Bussiness Economics, 33, 353–373. https://doi.org/10.1007/s11187-009-9178-6
Chu, W. (2011). Family ownership and firm performance: influence of family management, family control, and firm size. Asia Pacific Journal of Management, 28(4), 833–851. https://doi.org/10.1007/s10490-009-9180-1
Cucculelli, M., & Micucci, G. (2008). Family succession and firm performance: evidence from Italian family firms. Journal of Corporate Finance, 14(1), 17–31. https://doi.org/10.1016/j.jcorpfin.2007.11.001
Daily, C. M., & Dollinger, M. J. (1992). An empirical examination of ownership structure in family and professionally-managed firms. Family Business Review, 5(2), 117–136. https://doi.org/10.1111/j.1741-6248.1992.00117.x
Daily, C. M., Johnson, J. L., Ellstrand, A. E., & Dalton, D. R. (1998). Compensation committee composition as a determinant of CEO compensation. Academy of Management Journal, 41(2), 209-220. https://doi.org/10.5465/257103
Dalton, D. R., Daily, C. M., Ellstrand, A. E., & Johnson, J. L. (1998). Meta-analytic reviews of board composition, leadership structure and financial performance. Strategic Management Journal, 19(3), 269-290. https://doi.org/10.1002/(SICI)1097-0266(199803)19:3<269::AID-SMJ950>3.0.CO;2-K
Danes, S. M., Stafford, K., Haynes, G., & Amarapurkar, S. S. (2009). Family capital of family firms: bridging human, social, and financial capital. Family Business Review, 22(3), 199-216. https://doi.org/10.1177/0894486509333424
Davis, J. H. (1997). Toward a stewardship theory of management. Academy Management Review, 22(1), 20-47. https://doi.org/10.2307/259223
Davis, J. A., & Tagiuri, R. (1989). The influence of life stage on father‐son work relationships in family companies. Family Business Review, 2(1), 47-74. https://doi.org/10.1111/j.1741-6248.1989.00047.x
Davis, J. H., Allen, M. R., & Hayes, H. D. (2010). Is blood thicker than water? A study of stewardship perceptions in family business. Entrepreneurship Theory and Practice, 34(6), 1093–1115. https://doi.org/10.1111/j.1540-6520.2010.00415.x
De Andres, P. Azofra, V., & Lopez, F. (2005). Corporate boards in OECD countries: size, composition, functioning and effectiveness. Corporate Governance: An International Review, 13(2), 197-210. https://doi.org/10.1111/j.1467-8683.2005.00418.x
Donckels, R., & Fröhlich, E. (1991). Are family businesses really different? European experiences from STRATOS. Family Business Review, 4(2), 149-160. https://doi.org/10.1111/j.1741-6248.1991.00149.x
Donnelley, R. G. (1988). The family business. Family Business Review, 1(4), 427-445. https://doi.org/10.1111/j.1741-6248.1988.00427.x
Dyer, W. G. Jr. (2006). Examining the ‘‘family effect’’ on firm performance. Family Business Review, 19(4), 253–273. https://doi.org/10.1111/j.1741-6248.2006.00074.x
Eddleston, K. A., & Kellermanns, F. W. (2007). Destructive and productive family relationships: a stewardship theory perspective. Journal of Business Venturing, 22(4), 545–565. https://doi.org/10.1016/j.jbusvent.2006.06.004
Eddleston, K. A., Kellermanns, F. W., & Zellweger, T. M. (2012). Exploring the entrepre-neurial behavior of family firms: does the stewardship perspective explain differ-ences? Entrepreneurship Theory and Practice, 36(2), 347–367. https://doi.org/10.1111/j.1540-6520.2010.00402.x
Eisenhardt, K. M. (1989). Agency theory: an assessment and review. Academy of Management Review, 14(1), 57–74. https://doi.org/10.2307/258191
Fama, E. F., & Jensen, M. C. (1983). Separation of ownership and control. Journal of Law and Economics, 26(2), 327–349.
Filatotchev, I., Lien, Y. C., & Piesse, J. (2005). Corporate governance and performance in publicly listed, family-controlled firms: evidence from Taiwan. Asia Pacific Journal of Management, 22(3), 257–283. https://doi.org/10.1007/s10490-005-3569-2
García-Ramos, R., & García-Olalla, M. (2011). Board characteristics and firm performance in public founder and nonfounder-led family businesses. Journal of Family Business Strategy, 2(4), 220–231. https://doi.org/10.1016/j.jfbs.2011.09.001
Giovannini, R. (2010). Corporate governance, family ownership and performance. Journal of Management & Governance, 14, 145-166. https://doi.org/10.1007/s10997-009-9093-x
Gómez-Mejía, L. R., Núñez-Nickel, M., & Gutiérrez, I. (2001). The role of family ties in agency contracts. Academy of Management Journal, 44(1), 81-95. https://doi.org/10.2307/3069338
Habbershon, T. G., Williams, M., & MacMillan, I. C. (2003). A unified systems perspective of family firm performance. Journal of Business Venturing, 18(4), 451-465. https://doi.org/10.1016/S0883-9026(03)00053-3
Habbershon, T. G., & Williams, M. L. (1999). A resource-based framework for assessing the strategic advantage of family firms. Family Business Review, 12(1), 1-25. https://doi.org/10.1111/j.1741-6248.1999.00001.x
Hamelin, A. (2013). Influence of family ownership on small business growth. Evidence from French SMEs. Small Bussiness Economics, 41, 563–579. https://doi.org/10.1007/s11187-012-9452-x
Herrera-Madueño J., Larran-Jorge M., & Sánchez-Gardey G., (2011). Effects of family ownership on SME performance. European Journal of Family Business, 1(2), 5-16. https://doi.org/10.24310/ejfbejfb.v1i2.4020
Huse, M. (2000). Boards od directors in SMEs: a review and research agenda. Entrepreneurship and Regional Development, 12(4), 271-290. https://doi.org/10.1080/08985620050177912
Jackling, B., & Johl, S. (2009). Board structure and firm performance: evidence from India’s top companies. Corporate Governance: An International Review, 17(4), 492-509. https://doi.org/10.1111/j.1467-8683.2009.00760.x
Jensen, M., & Meckling, W. H. (1976). The theory of the firm: managerial behavior, agency costs and ownership structure. Journal of Financial Economics, 3(4), 305– 360. https://doi.org/10.1016/0304-405X(76)90026-X
Kowalewski, O., Talavera, O., & Stetsyuk, I. (2010). Influence of family involvement in management and ownership on firm performance: evidence from Poland. Family Business Review, 23(1), 45–59. https://doi.org/10.1177/0894486509355803
Laffranchini, G., & Braun, M. (2014). Slack in family firms: evidence from Italy (2006-2010). Journal of Family Business Management, 4(2), 171-193. https://doi.org/10.1108/JFBM-04-2013-0011
Le Breton–Miller, I., Miller, D., & Steier, L. P. (2004). Toward an integrative model of effective FOB succession. Entrepreneurship Theory and Practice, 28(4), 305-328. https://doi.org/10.1111/j.1540-6520.2004.00047.x
Le Breton-Miller, I., & Miller, D. (2009). Agency vs. stewardship in public family firms: a social embeddedness reconciliation. Entrepreneurship Theory and Practice, 33(6), 1169-1191. https://doi.org/10.1111/j.1540-6520.2009.00339.x
Lee, J. (2006). Family firm performance: further evidence. Family Business Review, 19(2), 103–114. https://doi.org/10.1111/j.1741-6248.2006.00060.x
Lisboa, I. (2016). Impact of financial crisis and family control on earning management of Portuguese listed firms. European Journal of Family Business, 6(2), 118-131. https://doi.org/10.1016/j.ejfb.2017.06.002
Maury, B. (2006). Family ownership and firm performance: empirical evidence from Western European corporations. Journal of Corporate Finance, 12(2), 321–341. https://doi.org/10.1016/j.jcorpfin.2005.02.002
McConaughy, D. L., Walker, M. C., Henderson, G. V., Jr., & Mishra, C. S. (1998). Founding family controlled firms: efficiency and value. Review of Financial Economics, 7(1), 1– 19. https://doi.org/10.1016/S1058-3300(99)80142-6
McConaughy, D. L., & Phillips, G. M. (1999). Founders versus descendants: the profitability, efficiency, growth characteristics and financing in large, public, founding-family-controlled firms. Family Business Review, 12(2), 123–131. https://doi.org/10.1111/j.1741-6248.1999.00123.x
McKnight, P. J., & Mira, S. (2003). Corporate governance mechanisms, agency costs and firm performance in UK firms. http://ssrn.com/abstract=460300
Miller, D., & Le Breton-Miller, I. (2006). Family governance and firm performance: agency, stewardship, and capabilities. Family Business Review, 19(1), 73–87. https://doi.org/10.1111/j.1741-6248.2006.00063.x
Miller, D., Le Breton-Miller, I., Lester, R. H., & Cannella, A. A., Jr. (2007). Are family firms really superior performers? Journal of Corporate Finance, 13(5), 829–858. https://doi.org/10.1016/j.jcorpfin.2007.03.004
Miller, D., Le Breton-Miller, I., & Scholnick, B. (2008). Stewardship vs. stagnation: an empirical comparison of small family and non-family business. Journal of Management Studies, 45(1), 51–78. https://doi.org/10.1111/j.1467-6486.2007.00718.x
Morck, R. S. (1988). Management ownership and market valuation: an empirical analysis. Journal of Financial Ecocomics, 20(1), 293-315. https://doi.org/10.1016/0304-405X(88)90048- 7
Morck, R., Percy, M., Tian, G., & Yeung, B. (2005). The rise and fall of the widely held firm: a history of corporate ownership in Canada. In Morck, R. (Ed.): A history of corporate governance around the world: family business groups to professional managers (pp. 65–148). Chicago: University of Chicago Press.
Pearson, A. W., Carr, J. C., & Shaw, J. C. (2008). Toward a theory of familiness: a social capital perspective. Entrepreneurship Theory and Practice, 32(6), 949-969. https://doi.org/10.1111/j.1540-6520.2008.00265.x
Peng, M. & Jiang, Y. (2010). Institutions behind family ownership and control in large firms. Journal of Management Studies, 47(2), 253-273. https://doi.org/10.1111/j.1467-6486.2009.00890.x
Pindado, J., Requejo, I., & Torre, C. D. L. (2008). Does family ownership impact positively on firm value? Empirical evidence from Western Europe. IFERA Nyenrode, Summer 2008.
Poutziouris, P., Savva, C., & Chadjielias, E. (2015). Family involvement and firm performance: evidence from UK listed firms. Journal of Family Business Strategy, 6(1), 14-32. https://doi.org/10.1016/j.jfbs.2014.12.001
Saito, T. (2008). Family firms and firm performance: evidence from Japan. Journal of the Japanese and International Economies, 22(4), 620–646. https://doi.org/10.1016/j.jjie.2008.06.001
Salerno, D. (2019). Does the private equity financing improve performance in family SMEs? Journal of Family Business Management, 9(1), 110-124. https://doi.org/10.1108/JFBM-12-2017-0046
San Martin-Reyna, J. M., & Duran-Encalada, J. A. (2012). The relationship among family business, corporate governance and firm performance: evidence from the Mexican stock exchange. Journal of Family Business Strategy, 3(2), 106–117. https://doi.org/10.1016/j.jfbs.2012.03.001
Schepers, J., Voordeckers, W., Steijvers, T., & Laveren, E. (2014). The entrepreneurial orientation–performance relationship in private family firms: the moderating role of socioemotional wealth. Small Bussiness Economics, 43, 39–55. https://doi.org/10.1007/s11187-013-9533-5
Schulze, W. S., Lubatkin, M. H., Dino, R. N., & Buchholtz, A. K. (2001). Agency relationships in family firms: theory and evidence. Organization Science, 12(2), 99-116. https://doi.org/10.1287/orsc.12.2.99.10114
Schulze, W. S., Lubatkin, M. H., & Dino, R. N. (2003). Toward a theory of agency and altruism in family firms. Journal of Business Venturing, 18(4), 473–490. https://doi.org/10.1016/S0883-9026(03)00054-5
Sciascia, S., Mazzola, P., Astrachan, J. H., & Pieper, T. M. (2012). The role of family ownership in international entrepreneurship: exploring nonlinear effects. Small Bussiness Economics 38, 15–31. https://doi.org/10.1007/s11187-010-9264-9
Sciascia, S., & Mazzola, P. (2008). Family involvement in ownership and management: exploring nonlinear effects on performance. Family Business Review, 21(4), 331–345. https://doi.org/10.1111/j.1741-6248.2008.00133.x
Sharma, P., Chrisman, J. J., & Chua, J. H. (1997). Strategic management of the family business: past research and future challenges. Family Business Review, 10(1), 1-35. https://doi.org/10.1111/j.1741-6248.1997.00001.x
Shleifer, A., & Vishny, R. W. (1997). A survey of corporate governance. Journal of Finance, 52(2), 737–783. https://doi.org/10.1111/j.1540-6261.1997.tb04820.x
Sirmon, D. G., & Hitt, M. A. (2003). Managing resources: linking unique resources, management and wealth creation in family firms. Entrepreneurship Theory and Practice, 27(4), 339-358. https://doi.org/10.1111/1540-8520.t01-1-00013
Sraer, D., & Thesmar, D. (2007). Performance and behavior of family firms: evidence from the French stock market. Journal of the European Economic Association, 5(4), 709–751. https://doi.org/10.1162/JEEA.2007.5.4.709
Tagiuri, R., & Davis, J. A. (1992). On the goals of successful family companies. Family Business Review, 5(1), 43-62. https://doi.org/10.1111/j.1741-6248.1992.00043.x
Tagiuri, R., & Davis, J. (1996). Bivalent attributes of the family firm. Family Business Review, 9(2), 199-208. https://doi.org/10.1111/j.1741-6248.1996.00199.x
Uhlaner, L. M., Floren, R. H., & Geerlings, J. R. (2007). Owner commitment and relational governance in the privately-held firm: an empirical study. Small Business Economics, 29(3), 275–293. https://doi.org/10.1007/s11187-006-9009-y
Villalonga, B., & Amit, R. (2006). How do family ownership, control and management affect firm value? Journal of Financial Economics, 80(2), 385-417. https://doi.org/10.1016/j.jfineco.2004.12.005
Weisbach, M. (1988). Outside directors and CEO turnover. Journal of Financial Economics, 20, 431-460. https://doi.org/10.1016/0304-405X(88)90053-0
Westhead, P., & Howorth, C. (2006). Ownership and management issues associated with family firm performance and company objectives. Family Business Review, 19(4), 301–316. https://doi.org/10.1111/j.1741-6248.2006.00077.x
Wiener-Fererhofer, A. (2017). Credit rating process: a distinction between family and non-family firms regarding their rating score. Journal of Family Business Management, 7(3), 256-290. https://doi.org/10.1108/JFBM-06-2017-0013
Williams Jr, R. (2018). Measuring family business performance: research trends and suggestions. Journal of Family Business Management, 8(2), 146-168. https://doi.org/10.1108/JFBM-12-2017-0047
Williams Jr, R., Pieper, T., Kellermanns, F., & Astrachan, J. (2019). Applying an organizational effectiveness approach to measure family business performance. Journal of Family Business Management, 9(3), 349-374. https://doi.org/10.1108/JFBM-01-2019-0002
Zahra, S. A., & Pearce, J. A. (1989). Boards of directors and corporate financial performance: a review and integrative model. Journal of Management, 15(2), 291-334. https://doi.org/10.1177/014920638901500208