
European Journal of Family Business (2021) 11, 56-71
Comparison of International Family Business Supply Chain Integration and Non-International Family Business Supply Chain Integration of the Food Industry Sector of Michoacán, Mexico
Bertha Molina-Quintanaa*, María Berta Quintana-Leóna
a Universidad Michoacana de San Nicolás de Hidalgo, Michoacán, Mexico
JEL CLASSIFICATION
F15, L22, L66, M11, M16, M21, O19
KEYWORDS
Supply chain integration, International family business supply chain integration, Non-international family business supply chain integration, Supplier integration, Customer integration
CÓDIGOS JEL
F15, L22, L66, M11, M16, M21, O19
PALABRAS CLAVE
Integración de la cadena de suministro, Integración de la cadena de suministro de la empresa familiar internacional, Integración de la cadena de suministro de la empresa familiar no internacional, integración de proveedores, integración de clientes
Abstract The purpose of this research is to compare the integration of supply chains in international family businesses and non-international family businesses in the food industry sector of Michoacán, México, in order to analyse the differences between the relationships of these businesses with their suppliers and customers in the international context. Supply chain integration was measured through the methodology of arcs of integration to graphically represent the integration of suppliers and customers. The measurement instrument was applied to 93 manufacturing companies, of which only 14 companies participated in an international context. Statistical tools such as analysis of variance were used to analyse the data and obtain valid results. The study determined that the internationalisation of family businesses contributes significantly to supply chain integration in terms of suppliers, but not in terms of customers.
Comparación de la integración de la cadena de suministro de empresas familiares internacionales y la integración de la cadena de suministro de empresas familiares no internacionales del sector de la industria de alimentos de Michoacán, México
Resumen El propósito de esta investigación es comparar la integración de la cadena de suministro de las empresas familiares internacionales con la integración de la cadena de suministro de empresas familiares no internacionales en el sector de alimentos de Michoacán, México, con el fin de analizar si existen diferencias entre las relaciones de las empresas con sus proveedores y clientes dado el contexto internacional. La integración de la cadena de suministro se midió a través de la metodología de arcos de integración, para representar gráficamente la integración hacia proveedores o clientes, ilustrada a través de un arco. El instrumento de medición se aplicó a 93 empresas familiares de fabricación de alimentos, de las cuales solo 14 empresas participaban en el mercado internacional. Se utilizaron estadísticas como ANOVA para analizar los datos y obtener resultados válidos. El estudio determinó que la internacionalización de la empresa familiar contribuye significativamente a la integración de la cadena de suministro en cuanto a proveedores, pero no en cuanto a clientes.
https://doi.org/10.24310/ejfbejfb.v11i2.10612
Copyright 2021: Bertha Molina-Quintana, María Berta Quintana-León
European Journal of Family Business is an open access journal published in Malaga by UMA Editorial. ISSN 2444-8788 ISSN-e 2444-877X
This work is licensed under a Creative Commons Atribution-NonCommercial-ShareAlike 4.0 International License (CC BY-NC-SA 4.0).
*Corresponding author
E-mail: bertha.molina@umich.mx
1. Introduction
Competitive global markets have a significant impact on businesses, both local and international, and supply chain integration is an important part of global markets (Sofyahoğlu & Öztürk, 2012). As trade barriers have been reduced, and information and logistics technologies have improved, buyer-supplier relationships increasingly involve not only domestic partners but also international partners (Li et al., 2010). Supply chain partners such as suppliers, customers, and service providers need to work closely because supply chain activities are becoming more dispersed, sometimes internationally (Leuschner et al., 2013). Thus, organisations are creating relationships of cooperation, collaboration, and mutual benefit with their supply chain partners to help them obtain competitive advantages and improve organisational performance.
Supply chain integration is the degree to which the suppliers, customers, and the activities within an organisation are integrated together. Supply chain integration helps companies reconfigure their resources and capabilities, internally and externally, to consolidate their supply chain as a whole in an effort to improve long-term performance (Huo, 2012; Huo et al., 2014). It is a collaborative process in which companies work together to achieve mutually acceptable results; however, this necessitates effective communication between all members of the supply chain.
Most papers discuss integration only at local levels and local cultures (Öberg, 2014); there is a lack of research on whether firms should follow local market strategies or develop their businesses on a global scale (Melén et al., 2017). Additionally, studies on supply chain integration have worked with companies from different countries in the same study; however, whether these companies work in a global or local market has been under-researched. There is still a lack of consensus on the efficacy of supply chain integration, especially when involving cross-country supply chain partners with different national cultures. Danese, Romano, and Formentini (2013) studied the use of an international supplier network. Wong, Sancha, and Gimenez (2017) and Durach and Wiengarten (2019) analysed the role of national culture and national collectivism values in supply chain integration.
It is similarly understudied whether internationalisation orientations with a more global scope can improve supply chain integration among small and medium-sized enterprises (SMEs), and family businesses (Knight & Cavusgil, 2004; Loane & Bell, 2006), and if so, how international SMEs and family businesses can benefit from locally oriented internationalisation strategies (Dodd & Hynes, 2012; Kibler, 2013). Therefore, there is a need for more studies that focus on the effects of local contexts on international development.
We attempt to address this gap in research by comparing the supply chain integration of international family businesses with that of non-international family businesses in the food industry sector of Michoacán, Mexico, to analyse whether there are differences between businesses’ relationships with their suppliers and customers in the international context. This study empirically analysed manufacturers’ supply chain integration strategies using evidence from a study of manufacturing strategy, and tested the relationship between supply chain integration and the international context. Frohlich and Westbrook’s arcs of integration was selected as methodology (Childerhouse & Towill, 2011; Frohlich & Westbrook, 2001; Schoenherr & Swink, 2012; Wong et al., 2017) after comparing ten different methodologies to measure the level of supply chain integration. Using survey responses from 93 manufacturing companies, we obtained the arcs of integration for group memberships generated in international and non-international family businesses, rationalised the classification scheme, and assessed the impact of supply chain integration strategies in an international context.
Therefore, an important goal of this study was to simultaneously consider upstream supplier and downstream customer integration during the analysis. This study develops a new way of characterising and comparing the level of supply chain integration, and thus defines different supply chain strategies for family businesses to participate in an international context. Finally, some implications of these findings for operations management strategy research and practice are suggested.
2. Literature Review and Hypothesis Development
Supplier integration is the integration of the upstream supply chain which involves a relationship between the company and the upstream supplier. Saleh (2015) defines supplier integration as the process of cooperation between the supplier and the organisation, which facilitates the exchange of information, knowledge, materials, and experiences. Organisations can integrate suppliers for various benefits, such as to acquire their resources and capabilities, accelerate time-to-market, improve innovation capacity, lower production costs, and improve quality (Perols et al., 2013).
With supplier integration, suppliers provide information and participate in decision making. The integration of suppliers refers to the acquisition of the supplier’s operational, technical, and financial information. Manufacturers and suppliers can share information, including on production, demand, and inventory levels. This information exchange results in improved production and product requirements, and improvements by utilising the capabilities and cost structure of the supplier and factory.
Dealing with foreign suppliers may be difficult due to variances in business practices, managerial attitudes, and cultural mores (Carter, 2000). To achieve an interorganisational exchange, incompatibilities and incongruences between the allied organisations in terms of their structure, culture, technology, and geography must be overcome (Smith & Barclay, 1997). This requires a positive relationship between trust and mutual satisfaction in channel relationships. Reciprocal facilitation, to facilitate meaningful communication between companies and communication at the same time, and a positive causal path from trust to cooperation and from trust to the functionality of conflict, which are the efforts to resolve disagreements, would facilitate the achievement of these results (Anderson & Narus, 1990). Additionally, sharing information, interaction frequency, and commitment will also be required to achieve these results (Rinehart et al., 2008).
Perceived task performance, which is the extent to which partners jointly expect fiduciary responsibility in the performance of their individual roles and believe that each will act in the best interest of the partnership, is also important to relationship effectiveness and mutual perceived trustworthiness. This mutual perceived trustworthiness has four dimensions: character (the way partners perceive each other’s personal attributes, or integrity, responsibility, dependability, consistency, discreteness, honesty, and willingness to be flexible for the benefit of the relationship), role competence (degree to which partners perceive each other as having the skills, abilities, and knowledge necessary for effective task performance), judgement (the belief that each partner is able to decide and act in an appropriate manner for furthering the joint interests of the partnership), and motives or intentions (good faith behaviours) (Rinehart et al., 2008; Smith & Barclay, 1997).
2.2. Customer integration
Customer integration refers to the degree to which a company collaborates with its customers to improve visibility and enable joint planning (Fisher et al., 1994; Wong et al., 2011). Furthermore, it refers to the acquisition of technological, marketing, production, and inventory information from customers. Customer integration considers customer opinions and involves them in the production process through methods that facilitate the relationship between customers and manufacturers (Lofti et al., 2013). It involves the integration of downstream supply chains.
The integration between manufacturers and customers positively influences performance results. Close relationships between manufacturers and customers help improve the accuracy of demand information, which helps reduce product design and production planning time for manufacturers. A high level of integration with customers reduces inventory, obsolescence, and costs (Flynn et al., 2010). Customer integration helps the manufacturer to better respond to customer needs, create greater value, and detect changes in demand more quickly, which leads to a better understanding of market expectations and the opportunities it brings (Swink et al., 2007).
The literature on internationalisation refers to acquisitions as one of several modes to reach new markets. The literature on acquisition describes the motives, methods for integration, and performance of mergers and acquisitions (Öberg, 2014). International acquisitions are considered ways of entering new markets, cultural differences at both company and country levels, knowledge transfer, and the creation of value from such acquisitions.
Customers’ motives to internationalise include cost reduction (production or resources are achieved at a lower price), revenue enhancement (creation of value), risk diversification through being less vulnerable to the financial situation in specific countries, coordination redeployed between firms (brands, sales forces, and marketing expertise), and the attainment of representation in a market where the acquirer already has customers, but lacks direct contact with them or administers them from abroad (Öberg, 2014).
2.3. Conceptual model and research hypothesis
A conceptual model was developed to explain the relationships between the constructs in the context of family businesses. Figure 1 illustrates the proposed conceptual model.
Figure 1. Conceptual model
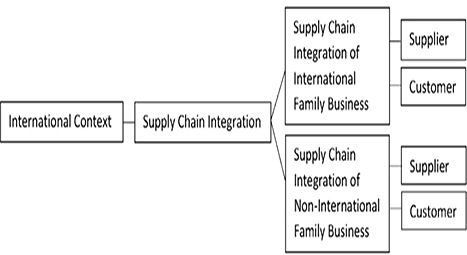
Source: Own elaboration
Supply chain integration of international family business, in this study, refers to family businesses that participate internationally, while supply chain integration of non-international family business refers to those that do not participate internationally. This leads to the hypothesis that we wish to examine:
Hypothesis 1. Family businesses with the greatest arcs of supplier and customer integration are those that participate in the international context.
3. Research Methods
3.1. Sample
The food sector, beverages, and tobacco economic activity includes 13 economic branches: meat industry, dairy products, canned food, processing and milling of cereals and other agricultural products, bakery products, nixtamal milling and tortilla manufacturing, edible oils and fats, sugar industry, cocoa, chocolate and confectionery, other food products, prepared animal food, beverages, and tobacco industries. However, for the purposes of this research, only the food sector was taken into account, without considering the prepared animal food, beverage, or tobacco industry. The National Institute of Statistics and Geography of Mexico (INEGI, 2019) defines the food industry as an economic unit mainly dedicated to the preparation, preservation, and packaging of food products for human consumption and for animals.
We took the definition of food industry from ProMéxico (2013) and Actinver (2015) and their classification for the food industry. Table 1 shows this classification with the frequency of companies in the food industry sector of Michoacán, denoting the sectors where international family businesses and non-international family businesses participate.
The companies were not classified by company size because we wanted to integrate as many companies as possible from the food industry sector. However, it is important to know the age of the companies in the sample to better understand their supply chain integration, and to be able to analyse companies that have embraced internationalisation. Table 2 shows the age of the companies.
Table 3 shows the frequencies and percentages of the profile of the companies participating in the research, with reference to the position of the interviewee in the company, the number of suppliers, the number of clients, and the number of employees.
Table 1. Frequency by food industry sector from the sample companies
|
Sector |
Frequency |
||
|
International family businesses |
Non-international family businesses |
||
|
Grinding grains and seeds |
2 |
9 |
|
|
2 |
Obtaining oils and fats |
2 |
2 |
|
3 |
Confectionery with and without cocoa |
5 |
16 |
|
4 |
Canned fruits |
2 |
5 |
|
5 |
Vegetables and prepared food |
2 |
30 |
|
6 |
Dairy products |
1 |
1 |
|
7 |
Meat and poultry processing |
0 |
6 |
|
8 |
Preparation and packaging of fish and seafood |
0 |
1 |
|
9 |
Bakery and tortillas |
0 |
9 |
|
Total |
14 |
79 |
|
Source: Own elaboration based on the collected data
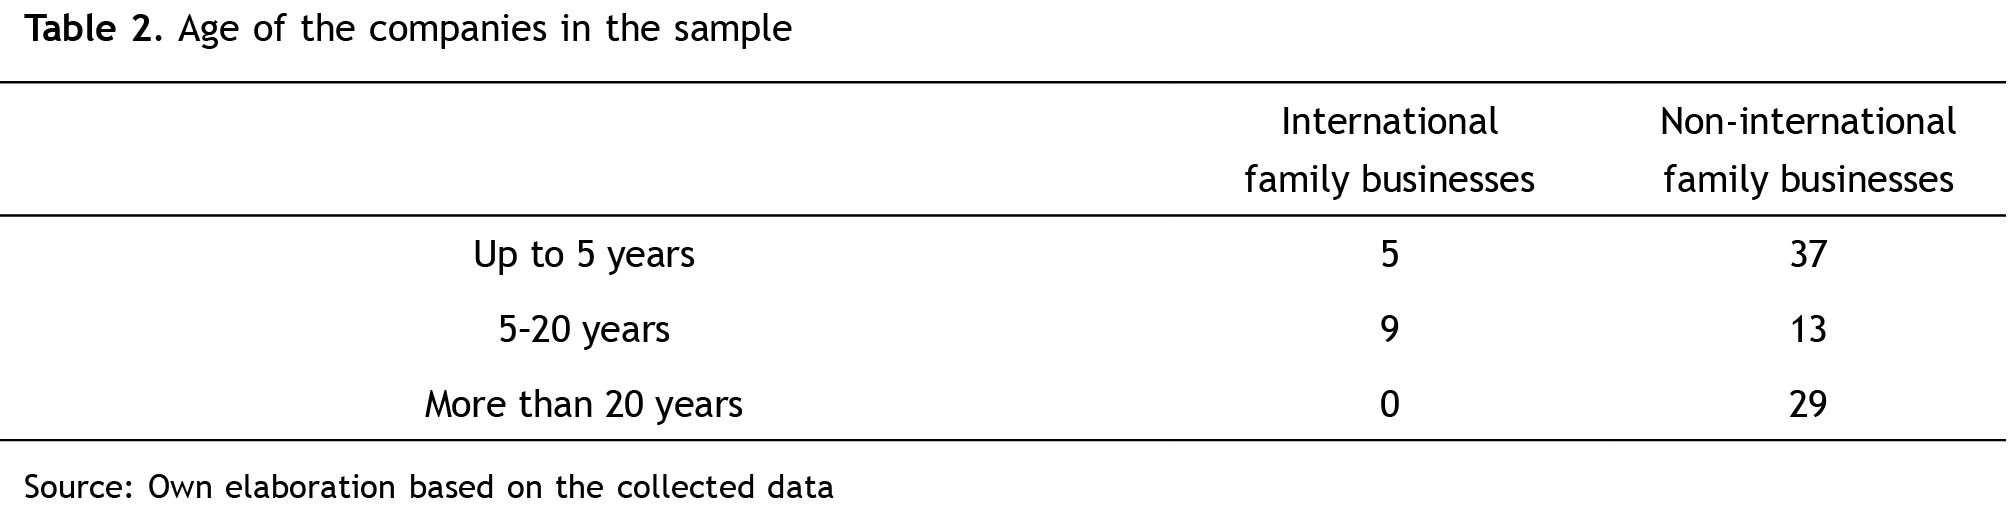
Table 3. Analysis of the companies participating in the research
|
Dimension |
|
Frequency |
Percentage |
|
Position of the interviewee in the company |
Supply chain coordinator |
2 |
2.15 |
|
Owner |
31 |
33.33 |
|
|
Administrator |
12 |
12.90 |
|
|
Director |
13 |
13.98 |
|
|
Manager |
29 |
31.18 |
|
|
Manufacturer |
6 |
6.45 |
|
|
Number of suppliers |
1–20 |
66 |
77.65 |
|
≥20–40 |
9 |
10.59 |
|
|
≥40–60 |
4 |
4.71 |
|
|
≥60–80 |
2 |
2.35 |
|
|
≥80–100 |
1 |
1.18 |
|
|
>100 |
3 |
3.53 |
|
|
Number of customers |
1–20 |
42 |
59.15 |
|
≥20–40 |
9 |
12.68 |
|
|
≥40–60 |
10 |
14.08 |
|
|
≥60–80 |
1 |
1.41 |
|
|
≥80–100 |
2 |
2.82 |
|
|
>100 |
7 |
9.86 |
|
|
Number of employees |
0–100 |
85 |
94.44 |
|
≥100–200 |
2 |
2.22 |
|
|
≥200–350 |
1 |
1.11 |
|
|
>500-1000 |
1 |
1.11 |
|
|
>1000 |
1 |
1.11 |
Source: Own elaboration based on the collected data
As we intended to compare the local context with the international context, it was important to know the origin of the companies’ supplies and the places where the companies sold their products (Table 4). Only the locations were collected, without mentioning sales, volumes, revenues, or any other monetary information, because of safety concerns in Michoacán.
Table 4. International context of family business in the food industry sector of Michoacán
|
Origin of supplies |
United States, Asia, Central America, North America, China, Italy, India, Sri Lanka, Chile. |
|
Main places where the products are sold |
United States, Europe, Canada, China, Central America, The Caribbean, Colombia, South of the United States, Laredo Texas, Salem Oregon, Twin falls Idaho, Atwater California. |
Source: Own elaboration based on the collected data
3.2. Methodology
The methodology we used to measure the level of integration of the supply chain was the arcs of integration of the supply chain proposed by Frohlich and Westbrook (2001), which measures the level of integration of the chain of external supply with suppliers and customers. In this method, the companies are classified according to the level of external integration into five categories: (1) inward-facing, (2) periphery-facing, (3) supplier-facing, (4) customer-facing, and (5) outward-facing.
The factor score for supplier integration was used to rank each manufacturer in the upper, middle, or lower quartiles. Similarly, the factor score for customer integration was used to rank each manufacturer in the correct quartile. Companies were classified according to the quartile in which they are located according to their level of integration with both customers and suppliers. Specifically, there are three different levels: the level below the Q1 quartile, the level above the Q3 quartile, and the intermediate level between both quartiles. With this criterion, five mutually exclusive groups were defined, as seen in Table 5, where the operationalisation of the integration arcs is presented (Molina-Quintana et al., 2021).
Table 5. Criterion of operationalisation of arcs of integration
|
Arc of integration |
Classification criterion |
|
Inward-facing |
In lower quartile for suppliers, and in lower quartile for customers. |
|
Periphery-facing |
Above lower quartile for suppliers or customers, but below upper quartile for suppliers and customers. |
|
Supplier-facing |
In upper quartile for suppliers, and below upper quartile for customers. |
|
Customer-facing |
In upper quartile for customers, and below upper quartile for suppliers. |
|
Outward-facing |
In upper quartile for suppliers, and in upper quartile for customers. |
Source: Frohlich and Westbrook (2001)
Figure 2 presents a graphical representation of the integration arcs, which measure the level of integration of the external supply chain with the key dimensions to represent graphically through an arc, a strategic position, such as direction towards customers and/or suppliers, and degree of integration.
The measurement instrument was applied to 93 family businesses in the food industry of Michoacán, México. A five-point Likert scale was used to determine how organisations have been implementing supply chain management in general. The participants were presented with statements or judgements to which they indicated their level of agreement with regards to their company. The statements or judgements had a positive, favourable, negative, or unfavourable direction. A five-point scale option was used because reliability balances out after a five-range scale, and there is minimal progressive utility when more than five points are used on a scale. An additional advantage of using Likert scales is the variability of the scores that result from the scale, which helps determine the percentage of positive and negative responses for an item.
Figure 2. Arcs of integration
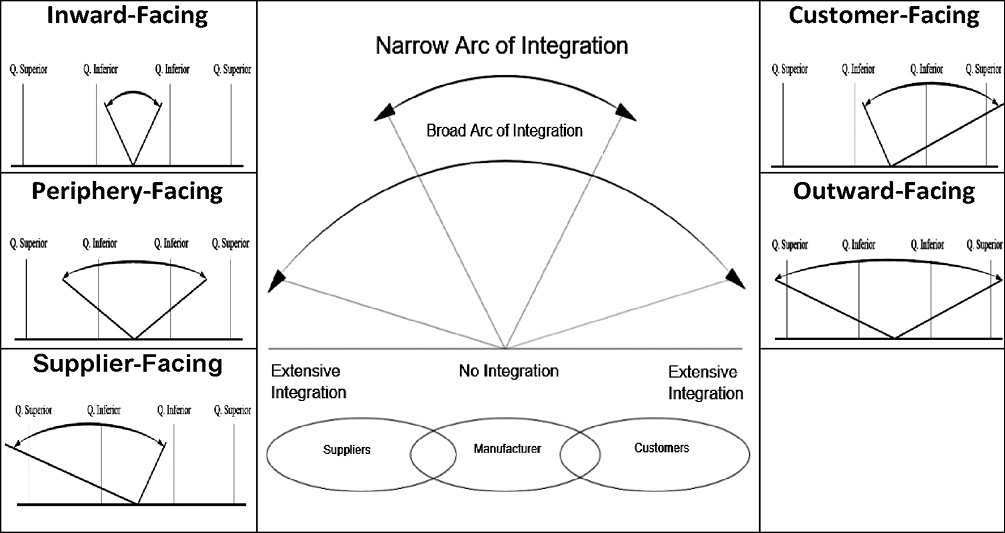
Source: Based on Frohlich and Westbrook (2001)
3.3. Statistical analysis
For a comparison of more than two groups, one-way analysis of variance (ANOVA) was determined to be the appropriate method instead of a t-test. As ANOVA is based on the same assumption as the t-test, the interest of ANOVA is also on the locations of the distributions represented by the means, because when the number of means is large, the relative location of the multiple group means can be more conveniently identified by analysing the variance among the group means than by comparing the many group means directly (Hae-Young, 2014). The different types of ANOVA are based on the null hypothesis that the mean of the variables studied is the same in the different groups, in contrast to the alternative hypothesis that the means differ significantly. ANOVA allows multiple means to be compared through the study of variances.
The basic operation of an ANOVA consists of calculating the mean of each of the groups and then comparing the variance of these means (variance explained by the group variable, intervariance) to the average variance within the groups (the one not explained by the group variable, intravariance). Under the null hypothesis that the observations of the different groups all come from the same population (they have the same mean and variance), the weighted variance between groups will be the same as the average variance within the groups. As the group means are further apart from each other, the variance between means will increase and will no longer be equal to the average variance within the groups.
The statistic studied in the ANOVA, known as Fratio, is the ratio between the variation of the means of the groups and the average of the variation within the groups. This statistic follows a distribution known as Fisher-Snedecor’s F. If the null hypothesis is fulfilled, the F statistic acquires a value of 1 because the intervariance will be equal to the intravariance. The greater the means of the groups, the greater the variance between means compared to the mean of the variance within the groups, leading to values of F greater than 1 and a lower probability that the distribution will acquire extreme values (lower the p-value). In the case of ANOVA, the two conditions are the normality of the groups and the homoscedasticity of variance. The adequacy of the model for the data was examined previously, and the normality of the error terms, or independence in the data, was verified. We validated the model by confirming that the basic hypotheses of the model did not contradict the observed data. For this purpose, simple graphical methods and statistical procedures were used.
First, we analysed the means of international and non-international companies referring to suppliers and then analysed the means of international and non-international companies referring to customers. The analysis of variance statistical technique, ANOVA, allows us to compare the mean of the integration of suppliers of international companies with the mean of the integration of suppliers of non-international companies and, in turn, the mean of integrating customers of international companies with the mean of non-international companies. Where design is A = 2, the independent variable or factor has two conditions: international family businesses and non-international family businesses.
The relationship between the group means using the F-ratio of the ANOVA would show whether there is a statistically significant difference between the means of the two conditions – companies that participate internationally and those that do not.
4.1. Analysis for suppliers
Table 6 shows the descriptive statistics for suppliers from the international family businesses and non-international family businesses.
The ANOVA for suppliers, with p-value = 0.001, indicates a significant effect: international businesses and non-international businesses have different integration levels. Homogeneity of variances can be accepted, as the Levene test p-value = 0.317.
Table 6. Descriptive statistics for suppliers
|
N |
Mean |
Std. Deviation |
Minimum |
Maximum |
|
|
International companies |
14 |
0.740357 |
0.7227617 |
- 0.3494 |
2.1395 |
|
Non-international companies |
79 |
- 0.131205 |
0.9295947 |
- 1.2940 |
2.1898 |
|
Total |
93 |
- 0.000002 |
0.9511330 |
- 1.2940 |
2.1898 |
Source: Own elaboration based on the collected data
The working hypothesis asks whether there are statistically significant differences between international family businesses and non-international family businesses in the food industry sector of Michoacán. The study of the possible differences between international and non-international companies in external integration with suppliers indicates that international companies obtain a higher average score (mean = 0.7404, SD = 0.7228, N = 14) than non-international companies (Mean = - 0.1312, SD = 0.9296, N = 79); that is, the difference is statistically significant (F (1.91) = 11.080, p < 0.001). As the intraclass level of significance (sig) is less than 0.05, we reject the hypothesis of equality of means; that is, there are significant differences between the groups. The assumption of homogeneity or equality in the variances of the two groups (international and non-international companies) is fulfilled by Levene F (1.91) = 1.01, p = 0.317).
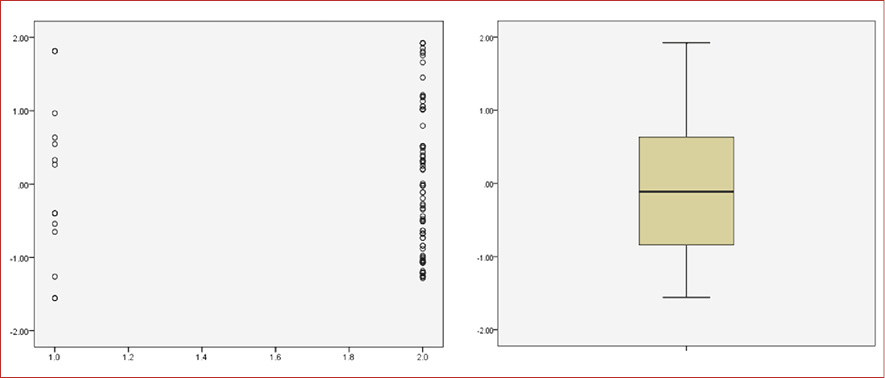
The graphical methods and statistical contrasts that we used to diagnose the adequacy of the analysis of the variance model are the residual distribution graph and the tests of equality of variances, respectively. The residual distribution graph was used as residuals, which are the estimators of the perturbations, constitute the main tool for the diagnosis of the model.
The residuals are calculated by studying their distribution for diagnostic purposes, because the best way to verify normality is to study the residuals of each observation with respect to the mean of the group to which they belong and the box-plot graphic representation to identify whether there are asymmetries, atypical data, or differences in variances. Both graphs are presented in Figures 3 and 4.
Figures 3-4. Standardised residuals and box-plot model for suppliers
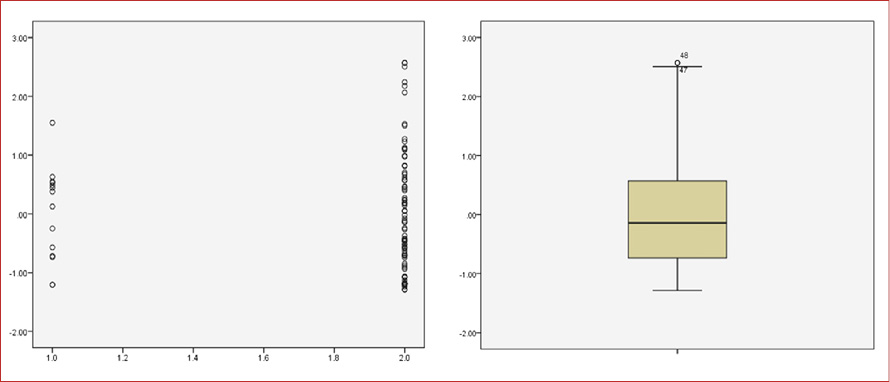
Source: Own elaboration based on the collected data
Figures 3 and 4 show, like Levene, that there are statistically significant differences between group 1 – international companies, and group 2 – non-international companies. The graphic representation of the residuals does not show a lack of homoscedasticity, as the groups seem to follow a symmetric distribution and the size of the boxes is similar for the two levels.
Table 7 shows the descriptive statistics for customers from international family businesses and non-international family businesses.
Table 7. Descriptive statistics for customers
|
N |
Mean |
Std. Deviation |
Minimum |
Maximum |
|
|
International companies |
14 |
0.090321 |
1.0731904 |
- 1.4218 |
1.8524 |
|
Non-International companies |
79 |
- 0.016003 |
0.9534478 |
- 1.2628 |
1.8524 |
|
Total |
93 |
0.000003 |
0.9669198 |
- 1.4218 |
1.8524 |
Source: Own elaboration based on the collected data.
A test of homogeneity of variances was performed, and a p-value of 0.616 indicated that the homogeneity of variance assumption was met. The ANOVA for customers, with p-value = 0.142 (greater than 0.05), allows us to accept the equality of means, that is, there are no significant differences between the groups.
The working hypothesis asks whether there are statistically significant differences between international family businesses and non-international family businesses in the food industry sector of Michoacán (Mexico). The study of the possible differences between international and non-international companies in external relationships with customers indicates that international companies obtain a higher average score (Mean = 0.0903, SD = 1.073, N = 14) than non-international companies (Mean = - 0.0160, SD = 0.9534, N = 79), with the difference being statistically significant, F (1.91) = 0.142, p > 0.707). As the intraclass level of significance (sig) is greater than 0.05, we accept the hypothesis of equality of means, that is, there are no significant differences between the groups. The assumption of homogeneity or equality of the variances of the two groups (international and non-international companies) is fulfilled (Levene F (1.91) = 0.253, p = 0.616). The adequacy of the analysis was verified by using the residual distribution graph and equality of variance tests. The graphs are presented in Figures 5 and 6.
Figures 5-6. Standardised residuals and box-plot model for customers
Source: Own elaboration based on the collected data
Similar to Levene, the figures show that there are no statistically significant differences between the two groups. The graphic representation of the residuals does not show a lack of homoscedasticity as the groups seem to follow a symmetric distribution and the size of the boxes is similar for the two levels.
4.3. Analysis of the integration of supply chains in international family businesses and non-international family businesses
Based on the results obtained in the survey, we individualised the results for each company in a recoded way (H = High, M = Medium, L = Low) to interpret the level of integration for each company. The individualised results for each company are presented below, and the level of integration with suppliers and customers are shown. This recoding allowed us to determine the arc of integration for each company, by measuring the level of integration for each company. The process of developing the methodology and statistics for the analysis of supply chain integration can be seen in detail in Molina-Quintana (2019) and Molina-Quintana et al. (2021).
The level of supplier integration and customer integration of international companies as well as the arc of integration that corresponds to each company, according to their level of integration, helped us understand the level of integration to fulfil the objectives of this work; therefore, we can compare and analyse if the international context makes a difference (see Appendix A for arcs of integration of international companies). The level of integration of suppliers and customers of non-international companies was similarly analysed (see Appendix B for arcs of integration of non-international companies).
Table 8 shows the frequencies of the different arcs of integration, as well as the graphic representation of the arc of integration for international family businesses and non-international family businesses.
Table 8. Number of companies for each arc of integration
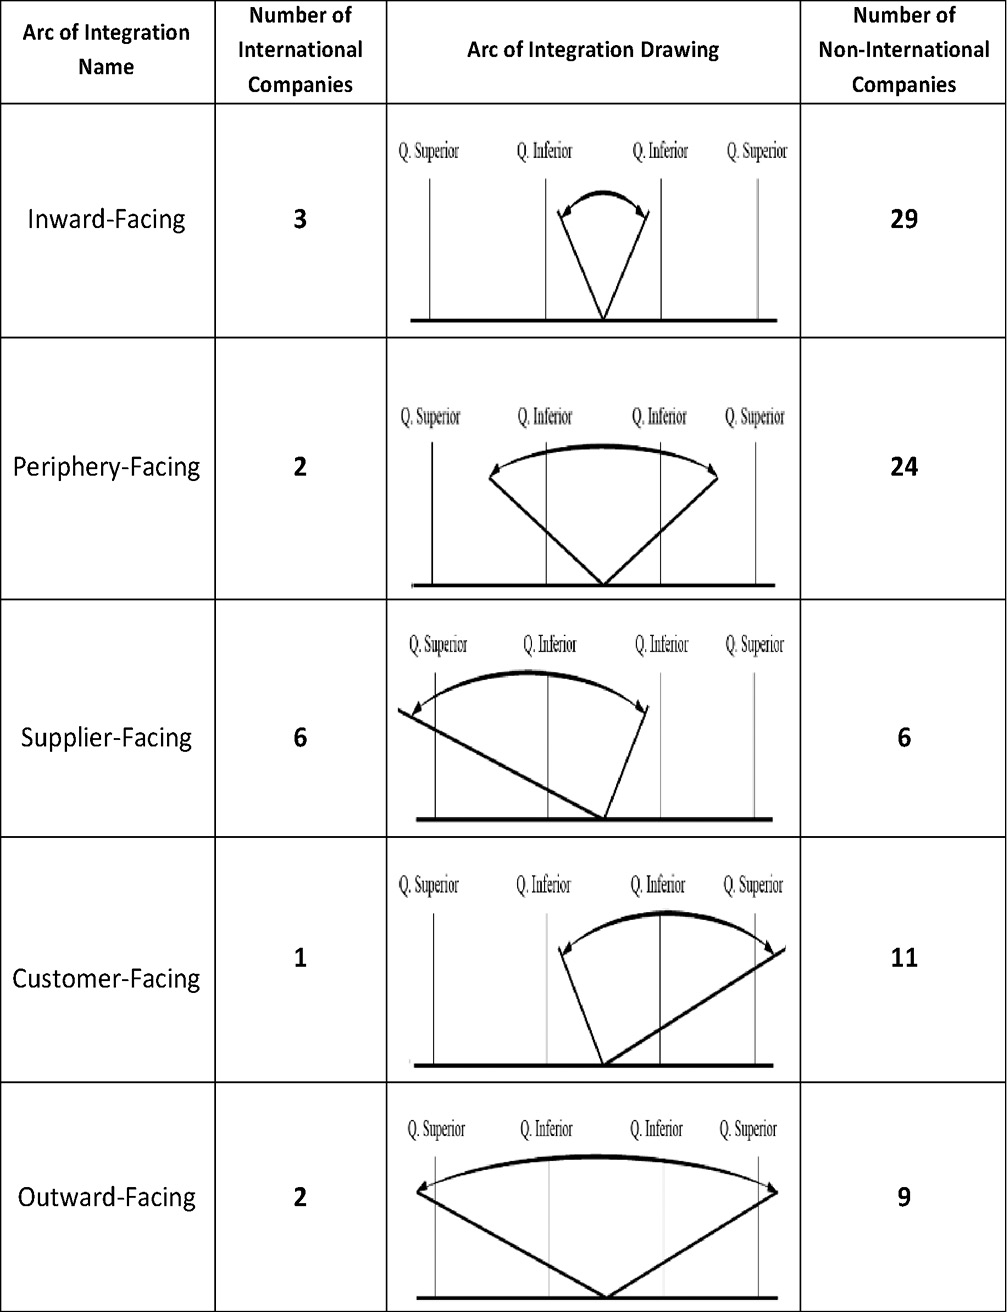
Source: Own elaboration based on the collected data
5. Discussion and Implications
The results of the ANOVA between univariate unifactorial groups of external integration with suppliers indicate that there is a statistically significant difference between the means of family businesses in the food industry sector of Michoacán of international and non-international companies. The assumption of homogeneity in the variances of the two groups was verified. The results show that the group of international family businesses have a higher average score than non-international family businesses.
According to the literature, the differences can be explained in part by the overcommitment of resources or production schedules; increase in prices when there is a shortage of supply of the purchased material or product; costs of international transactions; overestimation of demand to gain volume discounts (Carter, 2000); a negative causal relationship between functionality of conflict and conflict; disagreements with the suppliers blocking achievement of the firm’s goals, eliciting frustration, and thereby causing feelings of unpleasantness about the partnership (Anderson & Narus, 1990); differences in reputation (the degree to which partners perceive the other’s firm as having a better or worse reputation for professional conduct, ethics, and standards); job stability (turnover or differences in terms of the length of time to hold a particular position or territory); strategic horizons (the extent to which firms differ in their planning, strategy, and result orientations); control systems (the extent of incongruence in procedures for monitoring, directing, evaluating, and compensating employees); goals (the extent of incongruence in organisational goals or the tactics used to achieve them) (Smith & Barclay, 1997); and misunderstandings caused by language barriers and communication patterns – quantity rather than effectiveness of information sharing.
The results of the ANOVA between univariate unifactorial groups of external integration with customers indicate that there is no statistically significant difference between the means of family businesses in the food industry sector of Michoacán of international and non-international companies. The assumption of homogeneity in the variances of the two groups was verified. Therefore, the group of international family businesses obtains the higher average score when compared to non-international family businesses.
The lack of significant differences can be explained because customers universally demonstrate a spending pattern. Even though the customer’s ability to choose between local and foreign brands has increased, due to a similar level of access to technology and logistics facilities for all brands, there is little difference between buying locally and internationally. Young people are especially interested in buying foreign brands to differentiate their lifestyle or for brand characteristics (perceived quality and emotional value) (Kashi, 2013). Consumers may intend to purchase a particular brand because they perceive the brand offers the right features, quality, or emotional benefits but also tend to purchase by popularity; however this does not really affect food product buyers (as opposed to banking or insurance customers, for example).
Customers today are also more capricious: they keep changing as they have less time but are more conscientious. They shy away from stores and prefer experiences over products (Lobaugh et al., 2019). They tend to purchase goods that express their uniqueness and helps them gain acceptance from others. Additionally, consumers with a high need for uniqueness tend to adopt new products or brands more quickly (Kashi, 2013). The lifestyles of consumers are also changing, as they tend to prefer eating take out or going out to eat rather than cooking.
However, the literature also discusses the global phenomenon of food localisation, where consumers increasingly opt for local products for the benefit of society. These social motives are typically either environmental – to minimise food’s ecological footprints – or economic – to support local producers, which is a consumer tendency well-established in the literature on consumer ethnocentrism. Consumers may also consume local food products because of their personal benefits. This benefit may be either functional or symbolic. Functional benefits relate to the quality of food, which consumers typically perceive to be the highest for local food. Consumers tend to judge domestic foods as healthier and more natural than food from anywhere else. Symbolic benefits relate to the consumption of authentic food with tradition and integrity, as consumers associate local brands with authenticity because of their limited size and perceived linkage to a place, heritage, and localism (Rieftler, 2020). These factors tend to balance out the impact of internationalisation on family businesses in supply chain integration of consumers.
6. Conclusions
The internationalisation of the family business contributes significantly to the integration of the supply chain as regards to suppliers, but not customers. This may be because internationalisation of the family business with respect to its relationship with customers is more difficult to achieve. Developing joint objectives and responsibilities, achieving customer participation in the product design processes, establishing long-term relationships, and sharing information through information technologies is difficult. The companies may also have failed in sharing their demand forecasts and production plans, and in getting customers involved in the design processes of products. This could be explained by the low loyalty of buyers of food products (as opposed to banking or insurance customers).
Table 8 which shows the frequency of the level of external integration with suppliers and customers of international and non-international family businesses shows that the supplier integration for both contexts was a tie, 6 versus 6, while the customer integration was 1 versus 11, showing a clear edge for non-international companies. The literature shows that it is easier to get an integration with suppliers than with customers. In general, in the international context, the arc of integration with most frequency is supplier-facing and the arc with less frequency among all the arcs of integration is customer-facing, because it is difficult to obtain a relationship with customers, especially abroad. In the non-international context, the arc of integration with most frequency is inward-facing as internal integration is a regular way of working for companies. For non-international businesses the one with less frequency among all the arcs of integration is supplier-facing, because it is difficult for them to obtain a relationship with suppliers, especially abroad.
References
Actinver (2015). El sector de los alimentos procesados en México. Análisis Actinver Estudios Sectoriales y Regionales.
Anderson, J. C., & Narus, J. A. (1990). A model of distributor firm and manufacturer firm working partnerships. American Marketing Association, 54(1), 42-58. https://doi.org/10.1177/002224299005400103
Carter, C. R. (2000). Ethical issues in international buyer-supplier relationships: a dyadic examination. Journal of Operations Management, 18(2), 191-208. https://doi.org/10.1016/S0272-6963(99)00016-9
Childerhouse, P., & Towill, D. R. (2011). Arcs of supply chain integration. International Journal of Production Research, 49(24), 7441-7468. https://doi.org/10.1080/00207543.2010.524259
Danese, P., Romano, P., & Formentini, M. (2013). The impact of supply chain integration on responsiveness: the moderating effect of using an international supplier network. Transportation Research Part E: Logistics and Transportation Review, 49(1), 125-140. https://doi.org/10.1016/j.tre.2012.08.002
Dodd, S. D., & Hynes, B. C. (2012). The impact of regional entrepreneurial contexts upon enterprise education. Entrepreneurship & Regional Development: An International Journal, 24(9-10), 741-766. https://doi.org/10.1080/08985626.2011.566376
Durach, C. F., & Wiengarten, F. (2019). Supply chain integration and national collectivism. International Journal of Production Economics, 224, 107543. https://doi.org/10.1016/j.ijpe.2019.107543
Fisher, M., Hammond, J., Obermeyer, W. R., & Raman, A. (1994). Making supply meet demand in an uncertain world. Harvard Business Review, May-June, 83-93.
Flynn, B. B., Huo, B., & Zhao, X. (2010). The impact of supply chain integration on performance: a contingency and configuration approach. Journal of Operations Management, 28(1), 58-71. https://doi.org/10.1016/j.jom.2009.06.001
Frohlich, M. T., & Westbrook, R. (2001). Arcs of integration: an international study of supply chain strategies. Journal of Operations Management, 19(2), 185-200. https://doi.org/10.1016/S0272-6963(00)00055-3
Hae-Young, K. (2014). Analysis of variance (ANOVA) comparing means of more than two groups. Restorative Dentistry & Endodontics, 39(1), 74-7. https://doi.org/10.5395/rde.2014.39.1.74
Huo, B. (2012). The impact of supply chain integration on company performance: an organizational capability perspective. Supply Chain Management: An International Journal, 17(6), 596-610. https://doi.org/10.1108/13598541211269210
Huo, B., Qi, Y., Wang, Z., & Zhao, X. (2014). The impact of supply chain integration on firm performance: the moderating role of competitive strategy. Supply Chain Management: An International Journal, 19(4), 369-384. https://doi.org/10.1108/SCM-03-2013-0096
INEGI (Marzo de 2019). Instituto Nacional de Estadística y Geografía. Retrieved from: inegi.org.mx
Kashi, A. N. (2013). Exploring consumer purchase behaviour: foreign versus local brands. Global Business Review, 14(4), 587-600. https://doi.org/10.1177/0972150913501600
Kibler, E. (2013). Formation of entrepreneurial intentions in a regional context. Entrepreneurship & Regional Development: An International Journal, 25(3-4), 293-323. https://doi.org/10.1080/08985626.2012.721008
Knight, G. A., & Cavusgil, T. S. (2004). Innovation, organizational capabilities, and the born-global firm. Journal of International Business Studies, 35, 124-141. https://doi.org/10.1108/02651330610703409
Leuschner, R., Rogers, D. S., & Charvet, F. F. (2013). A meta-analysis of supply chain integration and firm performance. Journal of Supply Chain Management, 49(2), 34-57. https://doi.org/10.1111/jscm.12013
Li, Y., Xie, E., Teo, H.-H., & Peng, M. W. (2010). Formal control and social control in domestic and international buyer-supplier relationships. Journal of Operations Management, 28(4), 333-344. https://doi.org/10.1016/j.jom.2009.11.008
Loane, S., & Bell, J. (2006). Rapid internationalisation among entrepreneurial firms in Australia, Canada, Ireland and New Zealand: an extension to the network approach. International Marketing Review, 23(5), 467-485. https://doi.org/10.1108/02651330610703409
Lobaugh, K., Stephens, B., & Simpson, J. (2019). The consumer is changing, but perhaps not how you think. A swirl of economic and marketplace dynamics is influencing consumer behavior. Deloitte Review, 25, 102-103.
Lofti, Z., Sahran, S., Mukhtar, M., & Zadeh, A. T. (2013). The relationships between supply chain integration and product auality. Procedia Technology, 11, 471-478. https://doi.org/10.1016/j.protcy.2013.12.217
Melén, S., Rovira, E., & Tolstoy, D. (2017). New product development in foreign customer relationships: a study of international SMEs. Entrepreneurship & Regional Development, 29(7-8), 715-734. https://doi.org/10.1080/08985626.2017.1336257
Molina-Quintana, B. (2019). Ventajas competitivas a través de la integración de la cadena de suministro en las empresas de la industria de alimentos de Michoacán. Doctoral Thesis, Universidad Michoacana de San Nicolás de Hidalgo. Retrieved from http://bibliotecavirtual.dgb.umich.mx:8083/xmlui/handle/DGB_UMICH/1275 (last accessed: September, 2021).
Molina-Quintana, B., Vaamonde-Liste, A., Martínez-Arroyo, J. A., & Quintana-León, M. B. (2021). Arcs of integration: methodological and statistical analysis. In García-Alcaraz, J. L., Realyvásquez-Vargas, A., & Z-Flores, E. Trends in Industrial Engineering Applications to Manufacturing Process (pp. 35-58). Springer. https://doi.org/10.1007/978-3-030-71579-3_2
Öberg, C. (2014). Customer relationship challenges following international acquisitions. International Marketing Review, 31(3), 259-282. https://doi.org/10.1108/IMR-10-2012-0166
Perols, J., Zimmermann, C., & Kortmann, S. (2013). On the relationship between supplier integration and time-to-market. Journal of Operations Management, 31(3), 153-167. https://doi.org/10.1016/j.jom.2012.11.002
ProMéxico (2013). Alimentos Procesados. Ciudad de México: Secretaría de Economía.
Rieftler, P. (2020). Local versus global food consumption: the role of brand authenticity. Journal of Consumer Marketing, 37(3), 317-327. https://doi.org/10.1108/JCM-02-2019-3086
Rinehart, L. M., Lee, T.-R., & Page, Jr., T. J. (2008). A comparative assessment of domestic and international supplier-customer relationship perceptions. International Journal of Physical Distribution & Logistics Management, 38(8), 616-636. https://doi.org/10.1108/09600030810915143
Saleh, H. (2015). The impact of supply chain integration on operational performance at Jordanian pharmaceutical manufacturing organizations (Master’s Thesis). Amman, Jordan: Management Department-Business Faculty, Middle East University.
Schoenherr, T., & Swink, M. (2012). Revisiting the arcs of integration: cross-validations and extensions. Journal of Operations Management, 30(1-2), 99-115. -https://doi.org/10.1016/j.jom2011.09.001
Smith, B. J., & Barclay, D. W. (1997). The effects of organizational differences and trust on the effectiveness of selling partner relationships. Journal of Marketing, 61(1), 3-21. https://doi.org/10.1177/002224299706100102
Sofyahoğlu, C., & Öztürk, Ş. (2012). Meta analysis of the relationship between supply chain integration dimensions and firm performance. European Journal of Economics, Finance and Administrative Sciences, 52, 99-119.
Swink, M., Narasimhan, R., & Wang, C. (2007). Managing beyond the factory walls effects of four types of strategic integration on manufacturing plant performance. Journal of Operations Management, 25(1), 148-164. https://doi.org/10.1016/j.jom.2006.02.006
Wong, C. W., Sancha, C., & Gimenez, C. (2017). A national culture perspective in the efficaccy of supply chain integration practices. International Journal of Production Economics. https://doi.org/10.1016/j.ijpe.2017.08.015
Wong, C. Y., Boon-itt, S., & Wong, C. W. (2011). The contingency effects of environmental uncertainty on the relationship between supply chain integration and operational performance. Journal of Operations Management, 29(6), 604-615. https://doi.org/10.1016/j.jom.2011.01.003
Wong, C. Y., Wong, C. W., & Boon-itt, S. (2017). Do arcs of integration differ across industries? Methodology extension and empirical evidence from Thailand. International Journal of Production Economics, 183(Part A), 223-234. https://doi.org/10.1016/j.ijpe.2016.11.001
Appendix A. Arcs of integration for international companies
|
Company |
Suppliers’ level of integration |
Customers’ level of integration |
Arc of integration for international companies |
|
Company 1 |
M |
L |
Inward-facing |
|
Company 2 |
H |
M |
Supplier-facing |
|
Company 3 |
M |
M |
Periphery-facing |
|
Company 4 |
M |
M |
Periphery-facing |
|
Company 5 |
H |
M |
Supplier-facing |
|
Company 6 |
M |
H |
Customer-facing |
|
Company 7 |
H |
M |
Supplier-facing |
|
Company 8 |
H |
H |
Outward-facing |
|
Company 9 |
H |
H |
Outward-facing |
|
Company 10 |
H |
M |
Supplier-facing |
|
Company 11 |
H |
M |
Supplier-facing |
|
Company 12 |
M |
L |
Inward-facing |
|
Company 13 |
M |
L |
Inward-facing |
|
Company 14 |
H |
M |
Supplier-facing |
Source: own elaboration base on the collected data
Appendix B. Arcs of integration for non-international companies
|
Company |
Suppliers’ level of integration |
Customers’ level of integration |
Arc of integration for non-international companies |
|
Company 15 |
H |
H |
Outward-facing |
|
Company 16 |
M |
M |
Periphery-facing |
|
Company 17 |
H |
M |
Supplier-facing |
|
Company 18 |
M |
L |
Inward-facing |
|
Company 19 |
M |
M |
Periphery-facing |
|
Company 20 |
M |
L |
Inward-facing |
|
Company 21 |
M |
L |
Inward-facing |
|
Company 22 |
M |
M |
Periphery-facing |
|
Company 23 |
M |
L |
Inward-facing |
|
Company 24 |
M |
M |
Periphery-facing |
|
Company 25 |
M |
M |
Periphery-facing |
|
Company 26 |
L |
M |
Inward-facing |
|
Company 27 |
M |
L |
Inward-facing |
|
Company 28 |
M |
M |
Periphery-facing |
|
Company 29 |
M |
M |
Periphery-facing |
|
Company 30 |
L |
H |
Customer-facing |
|
Company 31 |
M |
M |
Periphery-facing |
|
Company 32 |
M |
H |
Customer-facing |
|
Company 33 |
L |
M |
Inward-facing |
|
Company 34 |
M |
M |
Periphery-facing |
|
Company 35 |
M |
M |
Periphery-facing |
|
Company 36 |
M |
M |
Periphery-facing |
|
Company 37 |
L |
M |
Inward-facing |
|
Company 38 |
L |
H |
Customer-facing |
|
Company 39 |
H |
H |
Outward-facing |
|
Company 40 |
L |
M |
Inward-facing |
|
Company 41 |
A |
M |
Supplier-facing |
|
Company 42 |
L |
L |
Inward-facing |
|
Company 43 |
L |
M |
Inward-facing |
|
Company 44 |
M |
L |
Inward-facing |
|
Company 45 |
H |
H |
Outward-facing |
|
Company 46 |
M |
M |
Periphery-facing |
|
Company 47 |
H |
H |
Outward-facing |
|
Company 48 |
H |
H |
Outward-facing |
|
Company 49 |
M |
M |
Periphery-facing |
|
Company 50 |
M |
L |
Inward-facing |
|
Company 51 |
M |
M |
Periphery-facing |
|
Company 52 |
L |
H |
Customer-facing |
|
Company 53 |
M |
M |
Periphery-facing |
|
Company 54 |
L |
L |
Inward-facing |
|
Company 55 |
M |
L |
Inward-facing |
|
Company 56 |
L |
L |
Inward-facing |
|
Company 57 |
L |
L |
Inward-facing |
|
Company 58 |
L |
H |
Customer-facing |
|
Company 59 |
M |
L |
Inward-facing |
|
Company 60 |
M |
M |
Periphery-facing |
|
Company 61 |
M |
M |
Periphery-facing |
|
Company 62 |
L |
L |
Inward-facing |
|
Company 63 |
M |
H |
Customer-facing |
|
Company 64 |
L |
H |
Customer-facing |
|
Company 65 |
L |
H |
Customer-facing |
|
Company 66 |
L |
L |
Inward-facing |
|
Company 67 |
M |
M |
Periphery-facing |
|
Company 68 |
M |
H |
Customer-facing |
|
Company 69 |
H |
L |
Supplier-facing |
|
Company 70 |
M |
L |
Inward-facing |
|
Company 71 |
M |
M |
Periphery-facing |
|
Company 72 |
M |
H |
Customer-facing |
|
Company 73 |
L |
M |
Inward-facing |
|
Company 74 |
H |
H |
Outward-facing |
|
Company 75 |
H |
M |
Supplier-facing |
|
Company 76 |
H |
H |
Outward-facing |
|
Company 77 |
M |
L |
Inward-facing |
|
Company 78 |
H |
H |
Outward-facing |
|
Company 79 |
H |
L |
Supplier-facing |
|
Company 80 |
M |
M |
Periphery-facing |
|
Company 81 |
L |
L |
Inward-facing |
|
Company 82 |
M |
M |
Periphery-facing |
|
Company 83 |
M |
H |
Customer-facing |
|
Company 84 |
M |
M |
Periphery-facing |
|
Company 85 |
L |
M |
Inward-facing |
|
Company 86 |
L |
M |
Inward-facing |
|
Company 87 |
M |
M |
Periphery-facing |
|
Company 88 |
L |
M |
Inward-facing |
|
Company 89 |
H |
H |
Outward-facing |
|
Company 90 |
M |
M |
Periphery-facing |
|
Company 91 |
H |
M |
Supplier-facing |
|
Company 92 |
L |
L |
Inward-facing |
|
Company 93 |
L |
M |
Inward-facing |
Source: Own elaboration base on the collected data