JUMOKE I. OLADELE
Department of Science and Technology Education.
Faculty of Education, University of Johannesburg, Johannesburg, South Africa
jumokeo@uj.ac.za
ORCID 0000-0003-0225-7435
 Esta obra está bajo licencia internacional Creative Commons Reconocimiento-NoComercial-CompartirIgual 4.0.
RESUMEN:
Los estudiantes pueden encontrar desafíos significativos cuando hacen la transición de la escuela secundaria a la universidad. Los estudiantes deben poseer las habilidades necesarias para adaptarse a la atmósfera de aprendizaje autodirigido de la universidad, sin embargo, a menudo carecen de la capacidad de asumir la responsabilidad de su propio aprendizaje. Este estudio emplea técnicas de modelado de rutas para investigar y analizar las relaciones multifacéticas entre varios factores, que pueden predecir el aprendizaje autorregulado a medida que afectan los logros académicos de los estudiantes Bibliografía existente. La población para este estudio fueron estudiantes universitarios de pregrado que utilizaron un cuestionario diseñado por investigadores para la recolección de datos. Los datos recogidos se modelaron reflexivamente mediante el modelo de ecuaciones estructurales de mínimos cuadrados parciales (PLS-SEM). Los resultados muestran que la evaluación del modelo de medida mostró una fuerte confiabilidad y validez convergente de los constructos latentes. Sin embargo, solo la tecnología predijo significativamente que el aprendizaje autorregulado contribuiría al éxito académico de los estudiantes en la educación superior. Los hallazgos de este estudio contribuyen significativamente a la comprensión de las vías matizadas a través de las cuales interactúan varios indicadores de aprendizaje para predecir la autorregulación de los estudiantes como influencia en el rendimiento académico de los estudiantes en el espacio de la educación superior. Los conocimientos obtenidos del análisis ofrecen valiosas implicaciones para las partes interesadas pertinentes con el fin de fomentar una conducta adecuadamente adaptada que mejore el éxito académico de los estudiantes en la educación superior.
PALABRAS CLAVE: Modelado de rutas, Éxito académico, enseñanza superior, Aprendizaje autorregulado, Modelado de ecuaciones estructurales, Tecnología
ABSTRACT:
Path modeling of factors that predict self-regulated learning: Case Study of a Public University in Nigeria
Students can encounter significant challenges when transitioning from high school to university. Students must possess the necessary skills to adjust to the self-directed learning atmosphere of the university, however frequently lack the ability to take responsibility for their own learning. This study employs path-modeling techniques to investigate and analyze the multifaceted relationships between various factors, which can predict self-regulated learning as they influence learners’ academic achievements in higher education settings, as informed by an extensive review of existing literature. The population for this study were university undergraduates using a researcher-designed questionnaire for data collection. The data collected was modelled reflectively using partial least squares structural equation modelling (PLS-SEM). Results show that the measurement model assessment showed strong reliability and convergent validity of the latent constructs. However, only technology significantly predicted self-regulated learning as contributing to students’ academic success in higher education. The findings from this study contribute significantly to understanding the nuanced pathways through which various learning indicators interact to predict students’ self-regulation as influencing students’ academic performance in the higher education space. Insights gained from the analysis offer valuable implications for relevant stakeholders aimed at fostering properly tailored conduct that enhances students’ academic success in higher education.
KEYWORDS: Inclusive education, leadership, teachers, primary education.
1. INTRODUCTION
Considering that students can encounter significant challenges when transitioning from high school to university, students must possess the necessary skills to adjust to the independent learning atmosphere of the university. Students frequently find themselves navigating a world where autonomy become crucial in the dynamic environment of higher education. As incubators of knowledge and human development, universities provide an atmosphere in which students are active participants in their own education rather than merely passive consumers of knowledge. University education gives students the academic independence to choose their own schedules while encouraging a sense of duty in their academic endeavors, which motivates individuals to take ownership of their education, practice good time management, and establish well-informed priorities (Moohr et al., 2021). This independence encompasses extracurricular activities, personal development projects, and even social interactions outside of the classroom (Christison, 2013; Ginosyan et al., 2022; Munadi & Khuriyah, 2023).
However, a major consideration width academic independence is self-regulation. Many students find that when they get to the university, it is the first time they have really manage their own schedules widthout the regimented direction of parents or teachers. Students must strike a careful balance between discipline and curiosity as they learn to manage the many obligations and opportunities that come width being a university student (McCombs, 2012; Pluck & Johnson, 2011, Shaeffer, 2006). Fundamentally, understanding how to control one’s own learning and behavior is the goal of self-regulation in higher education. This entails setting clear goals and objectives, good work organizational skills, being focus, and the readiness to modifying goals and objectives as necessary (Ozhiganova, 2018). It also entails developing self-awareness, realizing one’s advantages and disadvantages, and asking for help when needed.
Institutions are essential in helping students on their path to developing self-regulation. They offer tools including study skills seminars, academic advising, and counseling services to assist students in acquiring the knowledge and abilities needed to overcome obstacles. Additionally, they encourage students to accept responsibility for their actions and decisions by fostering a culture of accountability and responsibility (Elias, 2019; Jin et al., 2023). Ultimately, developing students’s capacity for self-regulation is crucial for both personal and professional development in addition to academic success (Etkin, 2018; Yan & Carless, 2022). It expose students to the lifelong learning skills, resilience, and adaptation qualities necessary to prosper in a world that is constantly changing (Binu, 2016; Wang, 2021). Higher education institutions are not just dispensing knowledge; they are also cultivating the self-regulated future leaders, innovators, and change-makers for global sustainability (Binagwaho et al., 2022; Chankseliani & McCowan, 2021; Grosemans et al., 2017; Mugimu, 2021).
Research indicates that students who exhibit self-regulation achieve higher academic performance (Sangaire, 2012; Xu et al., 2022). The focus on promoting self-regulated learning abilities has gained recognition as a vital component of successful education. In the realm of higher education, understanding the multifaceted factors that contribute to developing self-regulatory skills as it affects academic success is pivotal for educators, administrators, and policymakers. Therefore, upholding a supportive learning environment is essential in the ever-changing world of higher education to promote student achievement and institutional expansion as a whole is fast-gaining importance. The availability and adequacy of support facilities is a major indicator of quality in higher education (Oladele & Ndlovu, 2023). In addition, the effective use of technology into educational settings has greatly transformed the educational landscape in our fast-changing world (Aletan, 2021, Ayanwale & Oladele). Furthermore, technology facilitate the integration of content, facilitate communication, and offer tools for collaboration (Ayanwale & Oladele, 2021). Simultaneously, comprehending the connection between technology, the learning environment, and self-regulated learning is crucial for improving the educational experience and results for learners. This article delves into the application of path modeling to elucidate the intricate web of observable components contributing to self-regulation as an established factor for academic success in higher education.
1.1. Literature Review
It is therefore essential to provide the necessary support, guidance, and resources to ensure that students can effectively navigate this learning process and as affecting their academics. The journey of learning in the pursuit of education goes well beyond the walls of classrooms and textbooks. It is more than just memorizing things by heart or by rote; it includes developing a lifetime competency called self-regulated learning (SRL). SRL, which is defined as the process by which individuals take responsibility for their learning, embodies the metacognition, autonomy, and strategic approach that are essential for intellectual success (Winne & Perry, 2000; Zimmerman, 2015). SRL consists of four distinct phases: forethought, planning, and activation; monitoring control; and reaction and reflection (Torrano Montalvo & González Torres, 2004). SRL is a learner-centered approach that emphasizes goal setting and empowers the students to take charge of their own learning environment. Encouraging students to be more aware of the learning process and fostering SRL can transfer responsibility for learning from teachers to students (Puustinen & Pulkkinen, 2001). This represents a significant departure from the traditional belief that personalized teaching and learning are the responsibility of the teacher, who designs and executes classroom tactics to engage and educate students. This connotes that SRL redirects the focus on the student, necessitating their active engagement in the learning process (Taranto & Buchanan, 2020).
Three fundamental elements are involved in self-regulated learning: motivation, strategic action, and metacognition (Peel, 2019). The awareness and comprehension of one’s own cognitive processes is known as metacognition. It include examining, tracking, and self-reflection regarding one’s learning techniques. This feature enables people to recognize their advantages and disadvantages, allowing them to modify and improve their learning style. At the same time, motivation serves as the catalyst that advances this procedure. A key component is intrinsic motivation, which is driven by real love for learning, personal interest, and curiosity. Rewards and recognition are examples of extrinsic motivators that might affect learning. That being said, long-term interest and commitment to learning tasks are maintained by an internal desire.
The application of different learning methodologies in practice is refered to as strategic action. Setting goals, organizing, planning, managing time, and using productive study methods are a few of them. By using these techniques, students can better comprehend and retain material by navigating difficulties, breaking down work into digestible chunks, and applying a variety of problem-solving techniques. Self-regulated learning has several advantages that go well beyond scholastic success. It promotes independence by instilling a sense of accountability and ownership for one’s educational path. When students possess SRL skills, they develop into resilient and adaptive learners who can successfully negotiate the ever-changing information and obstacles of daily life. Self-regulated learning abilities need to be developed in a supportive atmosphere that promotes experimentation, exploration, and a growth mentality. By establishing learning environments that encourage autonomy, present chances for self-evaluation, and provide direction in the development of successful learning strategies, educators play a critical role in promoting SRL. To sum up, self-regulated learning is an art form as well as a technique—a set of abilities necessary to succeed in the complexity of the modern world. Through the development of metacognition, enthusiasm, and intentional action, people are empowered to choose their own educational path and acquire the skills necessary for success in the workplace, in the classroom, and in their personal lives. Accepting SRL gives people the ability to start a lifetime journey toward learning, development, and self-fulfillment.
This literature review also identifies key learning indicators contributing to SRL in higher education. While these indicators encompass both cognitive and non-cognitive factors. Cognitive factors include critical thinking skills, information-processing abilities, and metacognitive strategies have been widely researched. However, the non-cognitive factors such as instructional materials, collaborative activities, exposure to practical/hands-on experience, active classroom engagement, effective use of technology and online integrations in learning, learning environment as observable components that impact on self-regulated learning needs empirical evidence in the context of higher education. Recognizing the multifaceted nature of these indicators is essential for constructing a robust path model that captures their interconnectedness and cumulative effects on academic success.
Active student engagement is also key to successful teaching and learning in online situations where technology is leveraged for deploying teaching and learning and are increasingly popular (Khan et al., 2017). Technology is a major enabler of self-regulated learning and hold promises of improving the dwindling education quality (Khiat, 2022; Lawal, 2022; Olutola & Olatoye, 2022; Persico, 2017). Online resources, learning applications, and adaptive learning systems can offer individualized learning experiences by tracking progress, providing quick feedback, and customizing content to fit each learner’s unique learning preferences. But in the end, it is up to the person to cultivate self-regulated learning. It takes dedication to self-awareness, self-control, and persistence to cultivate SRL. To get the best learning outcomes, it necessitates a willingness to adjust, learn from mistakes, and continuously improve methods.
Technology integration in education typically refers to a technology-based approach to teaching and learning that is strongly related to the use of educational technology in classrooms (Oladele & Ndlovu, 2023). Technology integration in favorable learning contexts can promote and improve self-regulated learning (Timotheou et al., 2023). The majority of today’s students are regarded as Gen Z, and as such, they have a strong love for technology, which encourages their receptiveness (Oladele et al., 2024; Puangpunsi, 2021). Innovation and technological progress serve as a catalyst for a significant shift in education and creating room for collaboration as students imbibe self-regulation skills widthin the higher institutional learning spacing (Zhao & Cao, 2023). The University of Maryland like many other universities in developed countries has the Teaching Assistants (UTTA) program, which focuses on putting technically skilled students in an internship model width “needy” instructors. UTTA participants not only assist their faculty members width the technological requirements for college credit, but they also participate in a research seminar where the pedagogical consequences of teaching width technology are examined (Landavere & Mateik, 1999). Higher institutions in Africa should learn from such initiatives as part of efforts for improving the pedagogical processes width relevant technological integrations to support teaching learning width studies showing a positive impact (Oladele & Ndlovu, 2023; Oladele et al., 2024).
Collaboration involves students coming together to exchange ideas and co-create knowledge, fostering deep engagement width complex concepts through discussion and shared insights (De Corte, 2012; Laal & Laal, 2012). Meanwhile, self-regulated learning empowers students to take charge of their own learning journey by setting goals, monitoring progress, and adjusting strategies to achieve mastery (Kurt, 2023; Quick et al., 2020). These two forces, collaboration and self-regulated learning, intertwine to enhance each other. Together, collaboration and self-regulated learning create a transformative educational experience where students not only acquire knowledge but also develop lifelong learning skills and habits (Mebert et al., 2020). As such, they form a dynamic interplay, fueling curiosity and discipline, and ultimately contributing to the vibrant tapestry of inquiry and discovery in academia. Also, the role of instructional materials in teaching and learning cannot be overemphasized as they provide resources and tools to facilitate understanding and engagement (Amadioha, 2009; Cortana et al., 2021). Therefore, effective selection and integration of instructional materials are essential for promoting active learning, engagement, comprehension, and retention of knowledge among students. Additionally, factors such as accessibility, cultural relevance, and alignment width instructional goals and learning outcomes when designing and implementing instructional materials in teaching and learning contexts should be considered.
SRL is particularly important in the changing higher education landscape of academic independence. Various studies have been carried out in examining SRL. The performance indicators and course characteristics to support students’ self-regulated learning was examined revealing that while students appreciated the self-paced information, there was no impact on their study behavior and learning outcomes for the specific components examine (Ott et al., 2015). Also, an investigation was conducted to determine the most effective way to support self-regulated learning by utilizing the advantages of learning analytics. The findings revealed that the most effective interventions based on data do not aim to directly enhance students’ abilities through feedback. Instead, they focus on subtly influencing and encouraging students to reflect on and reevaluate the strategies they employ, how they assess their progress, and to assist them in making more informed decisions during the learning process. (Lodge et al., 2018). Another recent study by (Higgins, 2023) examined the impact of the development of self-regulated learning on academic performance in undergraduate science.
Another study focused on evaluating the assessment of SRL, which demonstrated that this construct possesses both aptitude and event characteristics. The phenomenon occurs widthin a diverse set of environmental and cognitive elements and abilities, and is evident in the repeated use of metacognitive monitoring and metacognitive control, which modify information when learners interact width a task (Winne & Perry, 2000). Furthermore, an analysis of research patterns regarding the assessment and intervention approaches utilized for self-regulated learning in e-learning environments spanned a decade (2008-2018). The findings of this evaluation indicated that conventional methods that were originally developed for classroom-based support to measure SRL in e-learning environments. Learner analytics and educational data mining techniques have been applied in a limited number of studies to assess and promote SRL strategies for students (Araka et al., 2020). Similarly, (Delfino, 2008) examined SRL widthin an adults virtual learning community where engage asynchronous textual communication were engaged. The results of the study demonstrated how well the students had utilized the opportunities provided by the learning environment, which included the activities, assignments, and methodology presented in addition to the software tools and their settings while taking advantage of learning opportunities usually gives rise to learning.
Also, integrating both active class engagement and self-regulated learning into teaching practices can create an environment where students are not only actively involved in their learning but also equipped width the skills to take ownership of their learning process especially in virtual learning environments (Aletan, 2022). While this can lead to improved academic performance, critical thinking skills, and lifelong learning habits, a study by Virtanen et al. (2017) investigated the impact of active learning and self-regulation on the development of professional competences in student instructors. The findings indicated that students who demonstrated outstanding SRL achieved significantly higher scores in professional competences, particularly as their experiences width active learning expanded. Similarly, Odum et al. (2021) verified long-term increases in students’ participation in active learning results were equivocal on whether there are meaningful differences in the redesigned classrooms width teaching led by an experienced faculty member, which supports the factor’s inclusion in this study. As a result, SRL has emerged as a crucial component of “future literacy,” empowering students to be more imaginative and creative, choose fresh course of action, and adjust to both present and emerging obstacles. The extent to which the multiple factors predict SRL is described as not only relevant to measure but also to scaffold SRL, width promising results (Karlen & Hertel, 2024; United Nations, 2018). Findings from this study is hoped to provide more tailored interventions over the coming years, which should be integrated into the existent body of knowledge (Panadero, 2017).
1.2. Theoretical Framework
SRL encompasses the cognitive, metacognitive, behavioral, motivational, and emotional/affective dimensions of the learning process (Puustinen & Pulkkinen, 2001; Shuy, 2010). Thus, it is an exceptional umbrella that encompasses a significant number of elements that impact learning, such as self-efficacy, volition, and cognitive strategies, all widthin a comprehensive and holistic framework (Panadero, 2017). Three stages make up Zimmerman’s (2000) SRL model: performance, self-reflection, and foresight. Students examine the assignment, make objectives, and devise plans for achieving them during the forethought phase. A variety of motivational beliefs energize the process and affect the activation of learning strategies. According to (Zimmerman, 2015) and (Puustinen & Pulkkinen, 2001), several models of self-regulation have incorporated learning elements as interactive components. These models aim to comprehend the relationship among learning processes by overcoming conceptual barriers. These models aims to clarify how learning width a focus on self-motivation and perseverance in the face of challenges and the passage of time. However, the interactive component of active classroom engagement, collaboration, instructional materials, learning environments, practical experience and technology as in impacts SRL is sparing in literature. As such, this study adapts the Pintrich’s (2000) model widthin the context of observable components of SRL. It is against this backdrop that this study aim at examining the path model of active class engagement, collaboration, instructional materials, learning environment, practical experience and technology integration in predicting self-regulated learning using the partial least square method which is a causal-predictive approach to SEM whose structures are intended to offer causal explanations (Hair et al., 2021). This aim would be achieved by determining the measurement and structural model width predicting predict self-regulated learning while testing the following alternate hypotheses:
H1: Active Class Engagement will significantly predict students SRL in higher institutions of learning
H2: Collaboration will significantly predict students SRL in higher institutions of learning
H3: Instructional Materials will significantly predict students SRL in higher institutions of learning
H4: Learning environment will significantly predict SRL learning in higher institutions of learning
H5: Practical Experience will significantly predict students SRL in higher institutions of learning
H6: Technological Integration will significantly predict students SRL in higher institutions of learning
2. Materials and Method
2.1. Design
The non-experimental descriptive case study design was adopted for this study width the purpose of describing observable components that can predict students’ self-regulation in detail widthin the higher education context (Yin, 2014). This design is deemed appropriate as it served as a valuable tool in predictive studies, providing insights into relationships between or among variables and aiding in the development of predictive models.
2.2. Participants, Context and Sampling
Students in a public (Government-owned) University in Nigeria served as the population for this study while the study’s target demographic were university undergraduates. The sample for the study were undergraduates in the teacher education programme (also known as trainee teacher) using the multi-staged sampling technique. In the first stage, the purposive sampling technique was employed to include teacher trainees in their final-year in the selected university. At the second stage, the convenience sampling technique was to reach students who were interested in participating in the study width one hundred and fifty four (154) participants. This sample size was theoretically adequate considering that there are six indicators having a minimum of five items each as associated width the self-regulated.
2.3. Instrumentation
The instrument for the study was a questionnaire width seven sub-scales to cather for both the latent construct and manifest variables (Active Classroom Engagement- 5 items; Collaboration- 5 items; Instructional Materials- 4 items; Learning Environment- 4 items; Practical Experience - 5 items; Self-Regulated Learning- 5 items; Technological Integration- 5 items). The instrument had a Likert Scale width Strongly Disagree: 1; Disagree: 2; Agree: 2 and Strongly Disagree: 4. As a preliminary activity, the instrument was subjected to face, and content validity by experts in educational measurement.
2.4. Procedure for data Collection
The designed instrument was administered using Google Forms. The link to the Google form link was shared on the students’ departmental WhatsApp platforms across the faculty. This procedure was closely followed up by a one-on-one follow up by two trained research assistants. The conditional progression function was activated so that only participants who consented to participate in the study could proceed to the scale sections, which required an average of 20 minutes to complete.
2.5. Data Analysis Techniques
Data obtained were analysed using Partial Least Square Structural Equation Modelling (PLS-SEM) to test the hypothetical model deemed appropriate being a variance-based approach supported width theory and grounded in existing knowledge (Dash & Paul, 2021; Forsyth, 2023). Given that the underlying aspects of self-regulation cannot be directly observed, they were assessed indirectly using many indicators, also referred to as manifest indicators, derived from replies to a validated questionnaire. The reason for employing PLS path modeling in this study was to optimize the explained variance of the dependent latent variable. Modeling using PLS path is considered the most comprehensive and versatile approach of the component-based structural equation modelling (SEM) techniques. PLS-SEM’s statistical properties provide very robust model estimations width data that have normal as well as extremely non-normal (i.e., skewness and/or kurtosis) distributional properties (Hair et al., 2021; Hair & Alamer, 2022). Worthy of note is that significant observations, outliers, and collinearity do affect the ordinary least squares regressions in PLS-SEM, which requires attention from researchers (Black et al., 2019). Thus, PLS path modelling was considered as an apt analytical technique (Ayanwale et al., 2021; Henseler et al., 2016; Henseler, 2017). The analysis was conducted using SmartPLS 4 software version 4.1.0.0 (Ringle et al., 2024).
Study Ethics: This study ensured informed consent as a requirement for studies involving human participants.
3. Results
3.1. Demographic Information (characteristics context)
The demographic Information of the respondents are shown in Table 1 revealing that equal number of male and female students participated in the study (77:50%) who were mostly widthin the age ranges of 20 to 30 years (139:90.3%), while others were below 20 (13:8.4%), and above 30 years (2:1.3%). Furthermore, the demographic information of the participants show that most of the students (143:92.9%) were admitted into the university through the foundational entry mode while a few of the participants were admitted through direct entry mode (11:7.15). In addition, the descriptive statistics of all the indicators in the study are shown in Table 2 showing the six indicators associated width the self-regulated construct having a minimum of five items each. This information is in line width the sample size estimation method of the “10-times rule” (Hair et al., 2011), which builds on the assumption that the sample size should be greater than 10 times the maximum number of inner or outer model links pointing at any latent variable in the model.
3.2. Evaluation of the measurement model
The measurement model defines the connection between the constructs inside the model width both exogenous and endogenous constructs. The exogenous construct (the six sub-constructs namely; Active Classroom Engagement-ACE; Collaboration-C; Instructional Materials-IM; Learning Environment-LE; Practical Experience-PE; and Technological Integration-TE respectively) and endogenous construct is Self-Regulated Learning-SRL is presented in Figure 1.
This study adopted the reflectively measurement model (width the arrows moving out of construct to each of the indicators) and it is assessed on the grounds of indicator reliability, internal consistency reliability, convergent validity, and discriminant validity and model fit statistics (Hair et al., 2021, Ayanwale & Ndlovu, 2024) as shown in Table 3a.
3.3. Indicator Reliability
This is determined by checking the external loadings of the indicators, which should range between 0.4 and 0.7 while figures greater than 0.70 as the most desirable Hair et al. (2011). The results shows that the indicator width the least value was 0.516 (ACE3- 0.516, C4- 0.594, C5- 0.592, IM4- 0.651, PE4- 0.687, PE5- 0.677) while the remaining indicator constituting over 82.35% of the indicators were well above 0.7 as shown in Table 3b. Therefore, all the indicators were retained and considered as reliable.
3.4. Internal Consistency reliability
The internal consistency of the scale was assessed through the composite reliability measure width a benchmark of 0.7 (Sarstedt et al., 2021, Ayanwale & Ndlovu, 2024). As shown in Table 2a, the reliability coefficients of 0.788, 0.855, 0.702, 0.797, 0.777, 0.859, 0.767 were obtained respectively. With a benchmark of 0.7, these values demonstrated that the instrument was reliable.
3.5. Convergent Validity
The convergent validity measure was determine using the average variance extracted (AVE) width a benchmark of 0.50 or more as preferable (Sarstedt et al., 2021, Ayanwale & Ndlovu, 2024). This connotes that greater than 50% of the variance of the reflective indicators have been accounted for by the construct. As shown in Table 3b, the average variance extracted values explained that all the constructs of this study had achieved the least benchmark of 0.50. Thus, measurement model indicator of convergent validity can be said to be achieved.
3.6. Discriminant Validity
This measure was determined using the Heterotrait-Monotrait ratio (HTMT) as the current gold standard to estimate the correlation between the six variables of the study width the threshold of 0.85 (Henseler et al., 2016).
As shown in Table 4, the coefficients obtained from this analysis were all below 0.85, which confirmed that the latent variables in the study are distinct and not excessively correlated width each other, thus demonstrating discriminant validity. Having established the measurement model (inner model), the next step is to proceed to assessing the structural model (outer model).
3.7. Assessment of the structural models (Hypotheses testing)
The structural model was assessed for collinearity issues among the predictor constructs of technological integration, Practical Experience, learning environment, instructional materials, collaboration, and active class engagement. The structural Model is shown in Figure 2.
Collinearity in the data set was assessed using the variance inflation factor (VIF) statistics (which measures the extent to which the variance of a predictor variable is inflated due to collinearity width a threshold of 5, Ayanwale & Ndlovu, 2024; Hair et al., 2009; Latif, 2024) as shown in Table 5.
As shown on Table 4, the highest VIF value for the outer model was 2.597 while that for the inner model was 1.823. Based on these findings, it was concluded that collinearity did not exist among the variables considered. Next was to assess the significance and relevance of path coefficients to establish the in-sample explanatory power of the structural model relationship using the data set for establishing the R2 statistics (where a value of 0.75 connotes a substantial power, 0.50, a moderate power and 0.25, a weak power) and effect size (Hair et al., 2019a). This analysis was also carried out through the bootstrapping function on SmartPLS software width results shown in Table 6.
Table 6 provide valuable information on the relationship between different constructs and self-regulated learning. Hypothesis (H1) asserts a positive and but insignificant relationship between the active classroom engagement and self-regulated learning, a stance not supported by the data (β = 0.138, t = 1.153, p > 0.25). This implies that active class engagement do not predict students self-regulated learning. This result was similar for H02 to H05 (collaboration- β = -0.046, t = 0.326, p > 0.75; instructional materials- β = -0.025, t = 0.219, p > 0.783; learning environment- β = 0.093, t = 0.691, p > 0.50 and practical experience- β = 0.077, t = 0.691, p > 0.50); which are all not supported width p values greater than 0.05. However, technological integration- β = 0.276, t = 2.569, p < 0.01 which was significant width p-value less than 0.05. This connotes that for every increase in technology integration by 1, self-regulated learning is enhanced by 0.276. To further strengthen the above finding, the confidence interval bias corrected statistics is reported (where 0 should not be present widthin the 2.5% and 97.5% range and this is ascertained width positive values widthin the ranges).
As shown in Table 7, the values ranged from negative to positive for the exogenous construct of active class engagement, collaboration, instructional materials, learning environment and practical experience (-0.082 to 0.391, -0.357 to 0.169, -0.316 to 0.156, -0.173 to 0.352 and -0.176 to 0.267) respectively width zero present. This connotes that will not affect the endogenous construct except for the positive values 0.068 to 0.49 for technological integration will affect the endogenous construct and in this case, the self-regulated learning.
Next in the procedure, the coefficient of determination (R2 value that ranges between 0 to 1 as stipulated by Hair et al., 2011, Sarstedt, 2021) is reported which represents the exogenous latent variables’ combined effect on the endogenous latent variable. This value also represents the amount of variance in the endogenous construct explained by the exogenous construct. The result is shown in Table 8.
As shown in Table 8, the R2 value of 0.194 which connotes technology integration impacts self-regulated learning, but width a weak explanatory power. Furthermore, in the analysis was to determine the effect size (f2) which is the change in R2 value when the specified exogenous construct is excluded from the model to assess the substantiveness of the impact on the endogenous construct. The guideline for f2 is 0.02, 0.15 and 0.35 interpreted as small, medium and large effect sizes respectively (Cohen, 1998; Cohen, 2013). The report is shown in Table 9.
Table 9 shows that the effect sizes of active class engagement, collaboration, instructional materials, learning environment and practical experience are very low while that of technological integration is moderate. The model fit was ascertained and this was determined using the Standardised Root Mean Residual (SRMR) and the Normative Fit Index (NFI). The SRMR was introduced as a goodness of fit measure for PLS-SEM that can be used to avoid model misspecification width value less than 0.10 or of 0.08 and NFI as 0.6 width values closer to 0.9 as desirable are considered a good fit (Henseler et al., 2014; SmartPLS, 2024). The model fit statistics are shown in Table 10.
As shown in Table 10, the SRMR is 0.081 and NFI as 0.6 are widthin the specified threshold. These findings support the notion that the measurement model satisfies recommended model estimate standards and provides a good fit to the data.
Lastly, the Q2 statistics was examined to ascertain the out-of-sample for establishing the predictive power for accurate prediction width other samples using new data sets algorithmically (PLSpredict) and the corresponding effect size (Latif, 2024; Hair et al., 2019b). This value represents how well the path model can predict the originally observed values and is usually generated for only the endogenous construct applicable width reflective models through a blind folding procedure. According to Maheta (2023), this procedure depends on the omission distance (D) width the value of seven (D=7) implying that every 7th data point of the target construct’s indicator is eliminated in a single blindfolding round. The author stressed that since the blindfolding procedure has to omit and predict every data point of the indicators used in the measurement model of a latent variable, this value comprise of seven blindfolding rounds and as such the number of blindfolding rounds always equal the omission distance D available in the PLSpredict menu in PLS 4. Results are shown in Table 11.
As shown in Table 10, the predictive relevance of the manifest and latent variables has the highest value of 6.5%, which is widthin the weak prediction region.
4. Discussion of Results
The reviewed literature stipulated that active class engagement, collaboration, instructional materials, learning environment, practical experience and technological integration were relevant predictors of self-regulated learning (Cortana et al., 2021; Khan et al., 2017; Khiat, 2022; Mebert et al., 2020; Zhao & Cao, 2023). However, the findings of the path modeling analysis, which was carried out in this study, provided insights into the complex interplay among the factors and their contributions to self-regulated learning among students in higher education revealing that only technological integration significantly impacted self-regulated learning. This finding is in line width the submission of Zhao & Cao (2023) who stressed that technological advancement serve as a catalyst for a significant shift in education and while encouraging students to imbibe self-regulation skills widthin the higher institutional learning spacing. Similarly, El-Azar (2022) identified technology as one of the major trends that will shape the future of higher education.
These submissions are germane considering that technology integration in favorable learning contexts can provides instruments for establishing objectives, monitoring progress, effective planning on accessing a wide range of online resources aids the cultivation of metacognitive abilities for promoting and improving self-regulated learning (Karlen & Hertel, 2024). Technology integration in this wise relates to educational platforms, which can be developed width the purpose of offering prompt feedback, which promotes introspection and self-evaluation (Timotheou et al., 2023). Technology is also fast-gaining relevance width the adoption of online classes in higher education regarded as the new normal and this is quite enhanced width the present generation of learners width a deep affinity for technological advancement (Puangpunsi, 2021). (Aletan, 2021; Ayanwale & Oladele, 2021; El-Azar, 2022; Oladele et al., 2024). This factor further strengthen the need for technology is a major enabler of self-regulated learning which requires the awareness and comprehension of students cognitive processes for success especially in the virtual learning space (Khiat, 2022; Peel, 2019). Technology promote peer contact, social learning, and the sharing of ideas, hence increasing motivation and engagement.
Universities as key players in delivering Higher Education are saddled width preparing future professionals and adequately delivering this mandate largely depends on how universities handle the complexities faced and the several conflicting crises and emergencies that intricately mitigate against achieving teaching and learning objectives in the dynamic environment. This situation necessitates striking a balance and taking ownership of their education, practice good time management, and establish well-informed priorities are requirements for meaningful self-regulated learning for academic success (Mcomb, 2012; Moohr et al., 2021). This is largely reflected in the dwindling quality of education in Nigeria and leveraging technology in tertiary institutions will enhance quality learning (Lawal, 2022; Olutola & Olatoye, 2022). United Nations (2022) also emphasized the role of higher education institutions in the transformation of future-fit education. In this sense, universities should be positioned to address such challenges by effectively leveraging technological integration in the teaching and learning process while providing adequate support systems as practiced in universities in developed countries (Ayanwale & Oladele, 2021; Landavere & Mateik, 1999).
5. Conclusion and Recommendations
The measurement model assessment showed strong reliability and convergent validity of the latent constructs, according to the study’s conclusion. Furthermore, because there was little to no correlation between the latent variables, the analysis demonstrated discriminant validity and validated the constructs’ internal consistency. According to this study, there was no discernible overlap or relationship between the assessed items and other variables in the study model, indicating that they successfully represented the intended constructs. However, only technology significantly predicted self-regulated learning as contributing to students’ academic success in higher education, which is insightful for understanding the multifaceted nature of student achievement and that, could inform evidence-based practices and policies aimed at enhancing educational outcomes. These insights hold significant implications for educational practitioners, policymakers, and institutions aiming to enhance students’ academic success. Implementing targeted interventions based on the identified pathway can optimize learning through tailor-fit instructional strategies, and support systems, ultimately fostering improved academic outcomes for diverse student populations in higher institutions of learning. It was therefore recommended that universities should integrate technology and required support for students in the University.
5.1. Limitation of the Study
This study conducted as a case study that places temporal and contextual boundaries in terms of generalizability on other populations. Therefore, a re-run will be necessary width different populations how bait the validated measurement model makes this a walk over width such research.
5.2. Conflict of Interest
The author declares no conflict of interest.
5.3. Research Funding
Funding was not received for this study.
6. REFERENCES
Aletan, S. (2022). Academic Performance in Online Classes of Undergraduates in Education: A Descriptive Study in Africa. International Journal of Educational Excellence, 8 (1), 45-64. https://doi.org/10.18562/IJEE.073
Amadioha, S. W. (2009). The importance of instructional materials in our schools an overview. New Era Research Journal of Human, Educational and Sustainable Development, 2 (3), 4-9. https://bit.ly/4c55WB9
Araka, E., Maina, E., Gitonga, R., & Oboko, R. (2020). Research trends in measurement and intervention tools for self-regulated learning for e-learning environments—systematic review (2008–2018). Research and Practice in Technology Enhanced Learning, 15, 1-21. https://doi.org/10.1186/s41039-020-00129-5
Ayanwale, M. A., & Ndlovu, M. (2024). Investigating factors of students’ behavioral intentions to adopt chatbot technologies in higher education: Perspective from expanded diffusion theory of innovation. Computers in Human Behavior Reports, 100396. https://doi.org/10.1016/j.chbr.2024.100396
Binagwaho, A., Bonciani Nader, H., Brown Burkins, M., Davies, A., Hessen, D. O., Mbow, C., ... & Tong, S. (2022). Knowledge-driven actions: transforming higher education for global sustainability: independent expert group on the universities and the 2030 agenda. UNESCO Publishing. https://doi.org/10.54675/YBTV1653
Binu, P. M. (2016). Self-regulation: Strategies for Lifelong Independent Learning. Vital Issues in English Language Teaching: Papers in Honour of Professor ZN Patil, 132-141. https://bit.ly/48JUkAK
Chankseliani, M., & McCowan, T. (2021). Higher education and the sustainable development goals. Higher Education, 81 (1), 1-8. https://doi.org/10.1007/s10734-020-00652-w
Christison, C. (2013). The Benefits of Participating in Extracurricular Activities. BU Journal of Graduate Studies in Education, 5 (2), 17-20.
Cohen, J. (1988). Statistical power analysis for the behavioral sciences (2nd ed.). Hillsdale, NJ: Lawrence Erlbaum.
Cohen, J. (2013). Statistical power analysis for the behavioral sciences. Routledge.
Dash, G., & Paul, J. (2021). CB-SEM vs PLS-SEM methods for research in social sciences and technology forecasting. Technological Forecasting and Social Change, 173, 121092. https://doi.org/10.1016/j.techfore.2021.121092
De Corte, E. (2012). Constructive, self-regulated, situated, and collaborative learning: An approach for the acquisition of adaptive competence. Journal of Education, 192 (2-3), 33-47. https://doi.org/10.1177/0022057412192002-307
Delfino, M., Dettori, G., & Persico, D. (2008). Self‐regulated learning in virtual communities. Technology, Pedagogy and Education, 17(3), 195-205.
El-Azar, D. (2022). 4 trends that will shape the future of higher education. February, World Economic Forum. https://bit.ly/3wJI6dS
Elias, M. J. (2019). Helping Students Develop Self-Regulation: Guiding students to create an ongoing cycle of growth in self-regulation starts width having them set explicit goals for themselves. Edutopia. https://www.edutopia.org/article/helping-students-develop-self-regulation
Etkin, J. (2018). Understanding Self-Regulation in Education. BU Journal of Graduate Studies in Education, 10 (1), 35-39. https://files.eric.ed.gov/fulltext/EJ1230272.pdf
Forsyth, S. B. (2023). What Is Variance-Based Research?October, 6. Medium. https://bit.ly/3VcQDAn
Ginosyan, H., Tuzlukova, V., & Ahmed, F. (2020). An investigation into the role of extracurricular activities in supporting and enhancing students’ academic performance in tertiary foundation programs in oman. Theory and Practice in Language Studies, 10(12), 1528-1534.
Grosemans, I., Coertjens, L., & Kyndt, E. (2017). Exploring learning and fit in the transition from higher education to the labour market: A systematic review. Educational Research Review, 21, 67-84. https://doi.org/10.1016/j.edurev.2017.03.001
Hair, J. F., Black, W. C., Babin, B. J., & Anderson, R. E. (2009). Multivariate data analysis (7th ed.). Prentice-Hall Inc. https://digitalcommons.kennesaw.edu/facpubs/2925/
Hair, J.F., Ringle, C.M., & Sarstedt, M. (2011). PLS-SEM: Indeed a silver bullet. The Journal of Marketing Theory and Practice, 19 (2), 139-152. https://doi.org/10.2753/MTP1069-6679190202
Hair, J. F., Black, W. C., Babin, B. J., & Anderson, R. E. (2019a). Multivariate data analysis (8th ed.). Cengage Learning. https://bit.ly/3wMG24U
Hair, J. F., Risher, J. J., Sarstedt, M., & Ringle, C. M. (2019b). When to use and how to report the results of PLS-SEM. European business review, 31(1), 2-24. https://doi.org/10.1108/EBR-11-2018-0203
Hair Jr, J. F., Hult, G. T. M., Ringle, C. M., Sarstedt, M., Danks, N. P., Ray, S., ... & Ray, S. (2021). An introduction to structural equation modeling. Partial least squares structural equation modeling (PLS-SEM) using R: a workbook, 1-29. Classroom Companion: Business. Springer, Cham. https://doi.org/10.1007/978-3-030-80519-7_1
Henseler, J., Dijkstra, T. K., Sarstedt, M., Ringle, C. M., Diamantopoulos, A., Straub, D. W., Ketchen, D. J., Hair, J. F., Hult, G. T. M., and Calantone, R. J. 2014. Common Beliefs and Reality about Partial Least Squares: Comments on Rönkkö & Evermann (2013), Organizational Research Methods, 17 (2): 182-209. https://doi.org/10.1177/1094428114526928
Henseler, J., Hubona, G., & Ray, P. A. (2016). Using PLS path modeling in new technology research: updated guidelines. Industrial management & data systems, 116 (1), 2-20. https://doi.org/10.1108/IMDS-09-2015-0382
Henseler, J. (2017). Partial least squares path modeling. Advanced methods for modeling markets, 361-381. https://doi.org/10.1007/978-3-319-64069-3_2
Higgins, N. L., Rathner, J. A., & Frankland, S. (2023). Development of self-regulated learning: a longitudinal study on academic performance in undergraduate science. Research in Science & Technological Education, 41(4), 1242-1266.
Jin, S. H., Im, K., Yoo, M., Roll, I., & Seo, K. (2023). Supporting students’ self-regulated learning in online learning using artificial intelligence applications. International Journal of Educational Technology in Higher Education, 20(1), 1-21. https://doi.org/10.1186/s41239-023-00406-5
Karlen, Y., & Hertel, S. (2024). Inspiring self-regulated learning in everyday classrooms: teachers’ professional competences and promotion of self-regulated learning. Unterrichtswissenschaft, 1-13. https://doi.org/10.1007/s42010-024-00196-3
Khan, A., Egbue, O., Palkie, B., & Madden, J. (2017). Active learning: Engaging students to maximize learning in an online course. Electronic Journal of e-learning, 15(2), pp. 107-115. https://search.informit.org/doi/abs/10.3316/ielapa.313660196196001
Khiat, H. V., S. (2022). A self-regulated learning management system: Enhancing performance, motivation and reflection in learning. Journal of University Teaching & Learning Practice, 19(2), 43-59. https://doi.org/10.53761/1.19.2.4
Kurt, S. (2023). Self-Regulated Learning: What It Is, Why It Is Important and Strategies for Implementing It. Educational Technology Consulting Services. https://educationaltechnology.net/self-regulated-learning-what-it-is-why-it-is-important-and-strategies-for-implementing-it/
Laal, M., & Laal, M. (2012). Collaborative learning: what is it?. Procedia-Social and Behavioral Sciences, 31, 491-495. https://doi.org/10.1016/j.sbspro.2011.12.092
Landavere, M., & Mateik, D. (1999, November). Training undergraduates to support technology in the classroom. In Proceedings of the 27th annual ACM SIGUCCS conference on user services: Mile high expectations(pp. 140-143). https://doi.org/10.1145/337043.337128
Latif, K.F. (2024). Understanding R Square, F Square, and Q Square using SMART-PLS. https://bit.ly/49TljLp
Lawal, I. (2022). Leveraging Technology in Tertiary Institutions will enhance quality learning. September, The Guardian. https://bit.ly/3veq1nO
Lodge, J. M., Panadero, E., Broadbent, J., & de Barba, P., G. (2018). Supporting self-regulated learning width learning analytics. In Learning analytics in the classroom (pp. 45-55). Routledge.
Maheta, D. (2022). Structural Model Assessment in SmartPLS-4. September 10, YouTube Video. https://youtu.be/3HbLcvcVJLQ?si=HKWOVMpLowmeMCnh
McCombs, B. (2012). Developing responsible and autonomous learners: A key to motivating students. American Psychological Association. http://www.apa. org/education/k12/learners.aspx
Mebert, L., Barnes, R., Dalley, J., Gawarecki, L., Ghazi-Nezami, F., Shafer, G., ... & Yezbick, E. (2020). Fostering student engagement through a real-world, collaborative project across disciplines and institutions. Higher Education Pedagogies, 5 (1), 30-51. https://doi.org/10.1080/23752696.2020.1750306
Moohr, M. L., Balint-Langel, K., Taylor, J. C., & Rizzo, K. L. (2021). Practicing academic independence: self-regulation strategies for students width emotional and behavioral disorders. Beyond Behavior, 30 (2), 85-96. https://doi.org/10.1177/10742956211020666
Mugimu, C. B. (2021). Higher Education Institutions (HEIs) in Africa embracing the “new normal” for knowledge production and innovation: Barriers, realities, and possibilities. In Higher Education-New Approaches to Accreditation, Digitalization, and Globalization in the Age of Covid. IntechOpen. https://doi.org/10.5772/intechopen.101063
Odum, M., Meaney, K., & Knudson, D. V. (2021). Active learning classroom design and student engagement: An exploratory study. Journal of Learning Spaces, 10 (1), 27-42. https://files.eric.ed.gov/fulltext/EJ1293141.pdf
Oladele, J. I., & Ndlovu, M. (2023). Digitising Standardised Educational Assessment in Africa Using Computerised Adaptive Testing: Transdisciplinary Framework for Action. In Impact of Disruptive Technologies on the Socio-Economic Development of Emerging Countries (pp. 104-117). IGI Global. https://doi.org/10.4018/978-1-6684-6873-9.ch007
Oladele, J. I., Ndlovu, M., Spangenberg, E. D., Daramola, D. S., & Obimuyiwa, G. A. (2024). Transitioning to Problem-Based Learning in Higher Education: Opportunities for Producing 21st-Century Pre-Service Teachers in Sub-Saharan Africa. Kurdish Studies, 12(2), 609-626. https://kurdishstudies.net/menu-script/index.php/KS/article/view/1838/1290
Olutola, A. T., & Olatoye, R. A. (2020). Enhancing quality of education in the university system: A study of Nigerian education system. Asian Journal of Assessment in Teaching and Learning, 10 (2), 55-61. https://doi.org/10.37134/ajatel.vol10.2.6.2020
Ott, C., Robins, A., Haden, P., & Shephard, K. (2015). Illustrating performance indicators and course characteristics to support students’ self-regulated learning in CS1. Computer Science Education, 25 (2), 174-198.
Ozhiganova, G. V. (2018). Self-regulation and self-regulatory capacities: components, levels, models. RUDN Journal of Psychology and Pedagogics, 15(3), 255-270. https://doi.org/10.22363/2313-1683-2018-15-3-255-270
Panadero, E. (2017). A Review of Self-regulated Learning: Six Models and Four Directions for Research [Review]. Frontiers in Psychology, 8. https://doi.org/10.3389/fpsyg.2017.00422
Peel, K. (2019). The Fundamentals for Self-Regulated Learning: A Framework to Guide Analysis and Reflection. Educational Practice and Theory, 41, 23-49. https://doi.org/10.7459/ept/41.1.03
Persico, D. S., K. & Steffens, K. (2017). Self-Regulated Learning in Technology Enhanced Learning Environments. In Technology Enhanced Learning (pp. 115-126). https://doi.org/10.1007/978-3-319-02600-8_11
Pluck, G., & Johnson, H. L. (2011). Stimulating curiosity to enhance learning. GESJ: Education Sciences and Psychology, 2. https://www.gesj.internet-academy.org.ge/en/list_artic_en.php?b_sec=edu&issue=2011-12
Portana, H. V., Fronda, J. G., Policarpio, D. G. T., Rigat, K. A. R. C., & Llames, G. A. (2021). Effectiveness and Acceptability of Instructional Materials in the Enhancement of Students’ Academic Achievement. International Journal of Advanced Engineering, Management and Science, 7(1). https://doi.org/10.22161/ijaems.71.2
Puustinen, M., & Pulkkinen, L. (2001). Models of Self-regulated Learning: A review. Scandinavian Journal of Educational Research, 45(3), 269-286. https://doi.org/10.1080/00313830120074206
Quick, J., Motz, B., Israel, J., & Kaetzel, J. (2020, March). What college students say, and what they do: aligning self-regulated learning theory width behavioral logs. In Proceedings of the tenth international conference on learning analytics & knowledge (pp. 534-543). https://doi.org/10.1145/3375462.3375516
Ringle, Christian M., Wende, Sven, & Becker, Jan-Michael. (2024). SmartPLS 4. Monheim am Rhein: SmartPLS. https://www.smartpls.com
Sangaire, E. M. (2012). Self-regulation and cultural orientation on the academic achievement of university students on distance education in Kampala, Uganda. A PhD Dissertation http://hdl.handle.net/20.500.12306/9299
Sarstedt, M., Ringle, C. M., & Hair, J. F. (2021). Partial least squares structural equation modeling. In Handbook of market research (pp. 587-632). Cham: Springer International Publishing. https://doi.org/10.1007/978-3-319-05542-8_15-1
Shuy, T. O. T. s. (2010). Self-regulated learning. TEAL Center Fact Sheet, 3. The Teaching Excellence in Adult Literacy (TEAL) Center, US Department of Education. https://lincs.ed.gov/sites/default/files/3_TEAL_Self%20Reg%20Learning.pdf
SmartPLS (2024). Fit Measures in SmartPLS. https://www.smartpls.com/documentation/algorithms-and-techniques/model-fit/
Taranto, D., & Buchanan, M. (2020). Sustaining Lifelong Learning: A Self-Regulated Learning (SRL) Approach. Discourse and Communication for Sustainable Education, 11, 5-15. https://doi.org/10.2478/dcse-2020-0002
Timotheou, S., Miliou, O., Dimitriadis, Y., Sobrino, S. V., Giannoutsou, N., Cachia, R., ... & Ioannou, A. (2023). Impacts of digital technologies on education and factors influencing schools’ digital capacity and transformation: A literature review. Education and information technologies, 28(6), 6695-6726. https://doi.org/10.1007/s10639-022-11431-8
Torrano Montalvo, F., & González Torres, M. (2004). Self-regulated learning: Current and future directions. J. Fuente, M. A. Eissa (Eds.). In International Handbook on applying self-regulated learning in different Education & Psychology. https://bit.ly/48LsuEe
United Nations (2018). Transforming the Future. Anticipation in the 21st Century. UNESCO, Routledge.
United Nations (2022). The Role of Higher Education Institutions in the Transformation of Future-Fit Education. September, Academic Impact. https://bit.ly/43iCdAz
Virtanen, P., Niemi, H., & Nevgi, A. (2017). Active learning and self-regulation enhance student teachers’ professional competences. Australian Journal of Teacher Education (Online), 42(12), 1-20. http://ro.ecu.edu.au/ajte/vol42/iss12/1
Wang, L. (2021). The role of students’ self-regulated learning, grit, and resilience in second language learning. Frontiers in psychology, 12, 800488. https://doi.org/10.3389/fpsyg.2021.800488
Winne, P. H., & Perry, N. E. (2000). Measuring self-regulated learning. In Handbook of self-regulation (pp. 531-566). Elsevier.
Xu, L., Duan, P., Padua, S. A., & Li, C. (2022). The impact of self-regulated learning strategies on academic performance for online learning during COVID-19. Frontiers in Psychology, 13,1047680.
Yan, Z., & Carless, D. (2022). Self-assessment is about more than self: the enabling role of feedback literacy. Assessment & Evaluation in Higher Education, 47(7), 1116-1128. https://doi.org/10.1080/02602938.2021.2001431
Yin R. K. (2014). Case study research and applications: Design and methods (6th ed.). SAGE Publications.
Zhao, S. R., & Cao, C. H. (2023). Exploring Relationship Among Self-Regulated Learning, Self-Efficacy and Engagement in Blended Collaborative Context. SAGE Open, 13(1). https://doi.org/10.1177/21582440231157240
Zimmerman, B. J. (2015). Self-Regulated Learning: Theories, Measures, and Outcomes. In J. D. Wright (Ed.), International Encyclopedia of the Social & Behavioral Sciences (Second Edition) (pp. 541-546). Elsevier. https://doi.org/10.1016/B978-0-08-097086-8.26060-1
Tables and Figures
Table 1: Demographic Information of Respondents
| Frequency | Percent | ||
| Age | 20 - 30 | 139 | 90.3 |
| Below 20 | 13 | 8.4 | |
| Above 30 | 2 | 1.3 | |
| Total | 154 | 100.0 | |
| Gender | Female | 77 | 50.0 |
| Male | 77 | 50.0 | |
| Total | 154 | 100.0 | |
| Mode of Entry | DE | 11 | 7.1 |
| UTNE | 143 | 92.9 | |
| Total | 154 | 100.0 |
Table 2: Descriptive statistics on indicators used in PLS-SEM
| Indicator | Mean | Median | Observed min | Observed max | Excess kurtosis | Skewness |
| ACE1 | 0 | -0.084 | -2.471 | 2.336 | 2.638 | 0.212 |
| ACE2 | 0 | 0.05 | -1.358 | 1.49 | 0.387 | -0.105 |
| ACE3 | 0 | 0.026 | -2.396 | 2.184 | 0.372 | -0.405 |
| ACE4 | 0 | 0.034 | -3.33 | 2.143 | 5.049 | -0.898 |
| ACE5 | 0 | 0.02 | -2.768 | 1.718 | 4.942 | -0.938 |
| C1 | 0 | 0.039 | -1.774 | 2.181 | 0.792 | -0.035 |
| C2 | 0 | 0.016 | -1.029 | 0.748 | 0.27 | -0.44 |
| C3 | 0 | 0.003 | -1.452 | 1.889 | 0.789 | -0.034 |
| C4 | 0 | 0.026 | -2.674 | 2.31 | 0.893 | -0.532 |
| C5 | 0 | -0.121 | -2.608 | 2.215 | 0.905 | -0.229 |
| IM1 | 0 | -0.046 | -1.929 | 1.606 | 0.239 | -0.023 |
| IM2 | 0 | -0.155 | -1.58 | 2.225 | 0.949 | 0.272 |
| IM3 | 0 | -0.009 | -2.19 | 1.759 | 0.809 | -0.45 |
| IM4 | 0 | 0.164 | -2.92 | 2.142 | 1.187 | -0.265 |
| LE1 | 0 | -0.083 | -1.397 | 1.723 | 0.763 | -0.024 |
| LE2 | 0 | 0.091 | -2.218 | 2.325 | 1.459 | -0.05 |
| LE3 | 0 | 0.049 | -2.153 | 1.338 | 1.191 | -0.501 |
| LE4 | 0 | -0.027 | -2.769 | 1.538 | 2.735 | -0.6 |
| PE1 | 0 | -0.085 | -1.659 | 2.832 | 3.109 | 0.715 |
| PE2 | 0 | -0.067 | -2.408 | 2.108 | 1.602 | -0.29 |
| PE3 | 0 | -0.042 | -2.587 | 1.418 | 2.202 | -0.705 |
| PE4 | 0 | 0.168 | -2.268 | 2.198 | 1.569 | -0.03 |
| PE5 | 0 | 0.04 | -4.085 | 2.451 | 7.403 | -1.047 |
| SRL1 | 0 | 0.068 | -1.93 | 2.036 | 0.866 | -0.057 |
| SRL2 | 0 | -0.015 | -1.596 | 1.902 | 1.618 | 0.25 |
| SRL3 | 0 | 0.045 | -1.865 | 1.79 | 0.949 | -0.152 |
| SRL4 | 0 | 0.101 | -2.472 | 1.665 | 2.329 | -0.628 |
| SRL5 | 0 | 0.082 | -1.957 | 1.429 | 1.943 | -0.018 |
| TOI1 | 0 | -0.026 | -2.931 | 2.512 | 2.023 | 0.011 |
| TOI2 | 0 | 0.081 | -3.595 | 2.643 | 6.322 | -0.529 |
| TOI3 | 0 | 0.019 | -2.422 | 1.958 | 1.003 | -0.344 |
| TOI4 | 0 | -0.045 | -2.275 | 1.755 | 1.13 | -0.219 |
| TOI5 | 0 | -0.055 | -2.776 | 1.47 | 2.717 | -0.797 |
Table 3a: Measurement model Assessment Indicators I
| Variables | Cronbach’s alpha |
| Active Class Engagement | 0.788 |
| Collaboration | 0.855 |
| Instructional Materials | 0.702 |
| Learning Environment | 0.797 |
| Practical Experience | 0.777 |
| Self-Regulated Learning | 0.859 |
| Technological Integration | 0.767 |
Table 3b: Measurement model Assessment Indicators II
| Indicator | Indicator Reliability (Outer loadings) | Composite Reliability (CR) | Average Variance Extracted (AVE) |
| ACE1 <- Active Class Engagement | 0.767 | ||
| ACE2 <- Active Class Engagement | 0.824 | ||
| ACE3 <- Active Class Engagement | 0.516 | ||
| ACE4 <- Active Class Engagement | 0.752 | ||
| ACE5 <- Active Class Engagement | 0.805 | 0.856 | 0.549 |
| C1 <- Collaboration | 0.742 | ||
| C2 <- Collaboration | 0.936 | ||
| C3 <- Collaboration | 0.811 | ||
| C4 <- Collaboration | 0.594 | ||
| C5 <- Collaboration | 0.592 | 0.859 | 0.557 |
| IM1 <- Instructional Materials | 0.732 | ||
| IM2 <- Instructional Materials | 0.789 | ||
| IM3 <- Instructional Materials | 0.713 | ||
| IM4 <- Instructional Materials | 0.651 | 0.813 | 0.523 |
| LE1 <- Learning Environment | 0.812 | ||
| LE2 <- Learning Environment | 0.736 | ||
| LE3 <- Learning Environment | 0.806 | ||
| LE4 <- Learning Environment | 0.786 | 0.866 | 0.617 |
| PE1 <- Practical Experience | 0.786 | ||
| PE2 <- Practical Experience | 0.723 | ||
| PE3 <- Practical Experience | 0.746 | ||
| PE4 <- Practical Experience | 0.687 | ||
| PE5 <- Practical Experience | 0.677 | 0.847 | 0.526 |
| SRL1 <- Self-Regulated Learning | 0.724 | ||
| SRL2 <- Self-Regulated Learning | 0.841 | ||
| SRL3 <- Self-Regulated Learning | 0.773 | ||
| SRL4 <- Self-Regulated Learning | 0.803 | ||
| SRL5 <- Self-Regulated Learning | 0.859 | 0.899 | 0.642 |
| TOI1 <- Technological Integration | 0.678 | ||
| TOI2 <- Technological Integration | 0.684 | ||
| TOI3 <- Technological Integration | 0.689 | ||
| TOI4 <- Technological Integration | 0.778 | ||
| TOI5 <- Technological Integration | 0.75 | 0.841 | 0.514 |
Table 4: Discriminant validity-HeteroTrait-MonoTrait ratio correlation
| Variables | Active Class Engagement | Collaboration | Instructional Materials | Learning Environment | Practical Experience | Self-Regulated Learning | Technological Integration |
| ACE | |||||||
| C | 0.336 | ||||||
| IM | 0.644 | 0.558 | |||||
| LE | 0.716 | 0.397 | 0.539 | ||||
| PE | 0.646 | 0.463 | 0.701 | 0.53 | |||
| SRL | 0.399 | 0.118 | 0.259 | 0.361 | 0.322 | ||
| TOI | 0.605 | 0.369 | 0.555 | 0.602 | 0.569 | 0.464 |
Table 5: VIF Statistics for the Outer and Inner Structural Model
| Indicators | Outer Model | Indicators | Inner Model |
| ACE1 | 1.668 | Active Class Engagement -> SRL | 1.823 |
| ACE2 | 2.086 | ||
| ACE3 | 1.184 | ||
| ACE4 | 1.594 | ||
| ACE5 | 1.848 | ||
| C1 | 1.981 | Collaboration -> SRL | |
| C2 | 2.053 | ||
| C3 | 1.826 | ||
| C4 | 1.66 | ||
| C5 | 1.959 | ||
| IM1 | 1.624 | Instructional Materials -> SRL | 1.602 |
| IM2 | 1.754 | ||
| IM3 | 1.554 | ||
| IM4 | 1.09 | ||
| LE1 | 1.7 | Learning Environment -> SRL | 1.688 |
| LE2 | 1.608 | ||
| LE3 | 1.579 | ||
| LE4 | 1.505 | ||
| PE1 | 1.566 | Practical Experience -> SRL | 1.619 |
| PE2 | 1.627 | ||
| PE3 | 1.561 | ||
| PE4 | 1.357 | ||
| PE5 | 1.423 | ||
| TOI1 | 1.297 | Technogical Integration -> SRL | 1.488 |
| TOI2 | 1.193 | ||
| TOI3 | 1.499 | ||
| TOI4 | 1.887 | ||
| TOI5 | 1.817 |
Table 6: Hypotheses testing summary statistics of the structural model
| Hypothesis | (β) | STDEV | T statistics | P values | Decision |
| H01- Active Class Engagement -> SRL | 0.138 | 0.12 | 1.153 | 0.249 | Not Supported |
| H02- Collaboration -> SRL | -0.046 | 0.141 | 0.326 | 0.745 | Not Supported |
| H03- Instructional Materials -> SRL | -0.025 | 0.116 | 0.219 | 0.826 | Not Supported |
| H04- Learning Environment -> SRL | 0.093 | 0.135 | 0.691 | 0.49 | Not Supported |
| H05- Practical Experience -> SRL | 0.077 | 0.112 | 0.691 | 0.49 | Not Supported |
| H06- Technological Integration -> SRL | 0.276 | 0.108 | 2.569 | 0.01 | Supported |
Self-Regulated Learning- SRL; Standard deviation
Table 7: Confidence interval bias corrected statistics
| O | M | Bias | 2.50% | 97.50% | |
| Active Class Engagement -> Self-Regulated Learning | 0.138 | 0.125 | -0.014 | -0.082 | 0.391 |
| Collaboration -> Self-Regulated Learning | -0.046 | -0.049 | -0.003 | -0.357 | 0.169 |
| Instructional Materials -> Self-Regulated Learning | -0.025 | 0.018 | 0.043 | -0.316 | 0.156 |
| Learning Environment -> Self-Regulated Learning | 0.093 | 0.081 | -0.012 | -0.173 | 0.352 |
| Practical Experience -> Self-Regulated Learning | 0.077 | 0.105 | 0.028 | -0.176 | 0.267 |
| Technological Integration -> Self-Regulated Learning | 0.276 | 0.271 | -0.005 | 0.068 | 0.49 |
Original sample- O, Sample Mean- M
Table 8: Coefficient of Determination Statistics
| R-square | R-square adjusted | |
| Self-Regulated Learning | 0.194 | 0.154 |
Table 9: Effect size of the exogenous construct on the endogenous construct
| f-square | |
| Active Class Engagement -> Self-Regulated Learning | 0.013 |
| Collaboration -> Self-Regulated Learning | 0.002 |
| Instructional Materials -> Self-Regulated Learning | 0.001 |
| Learning Environment -> Self-Regulated Learning | 0.006 |
| Professional Experience -> Self-Regulated Learning | 0.005 |
| Technological Integration -> Self-Regulated Learning | 0.064 |
Table 10: Model Fit Statistics
| Saturated model | Estimated model | |
| SRMR | 0.081 | 0.081 |
| d_ULS | 3.698 | 3.698 |
| d_G | 1.476 | 1.476 |
| Chi-square | 973.405 | 973.405 |
| NFI | 0.585 | 0.585 |
Table 11: Q² predict in Manifested Variable
| Variable | Estimated model | |
| Manifest | SRL1 | 0.045 |
| SRL2 | 0.043 | |
| SRL3 | 0.044 | |
| SRL4 | 0.037 | |
| SRL5 | 0.063 | |
| Latent | Self-Regulated Learning | 0.065 |
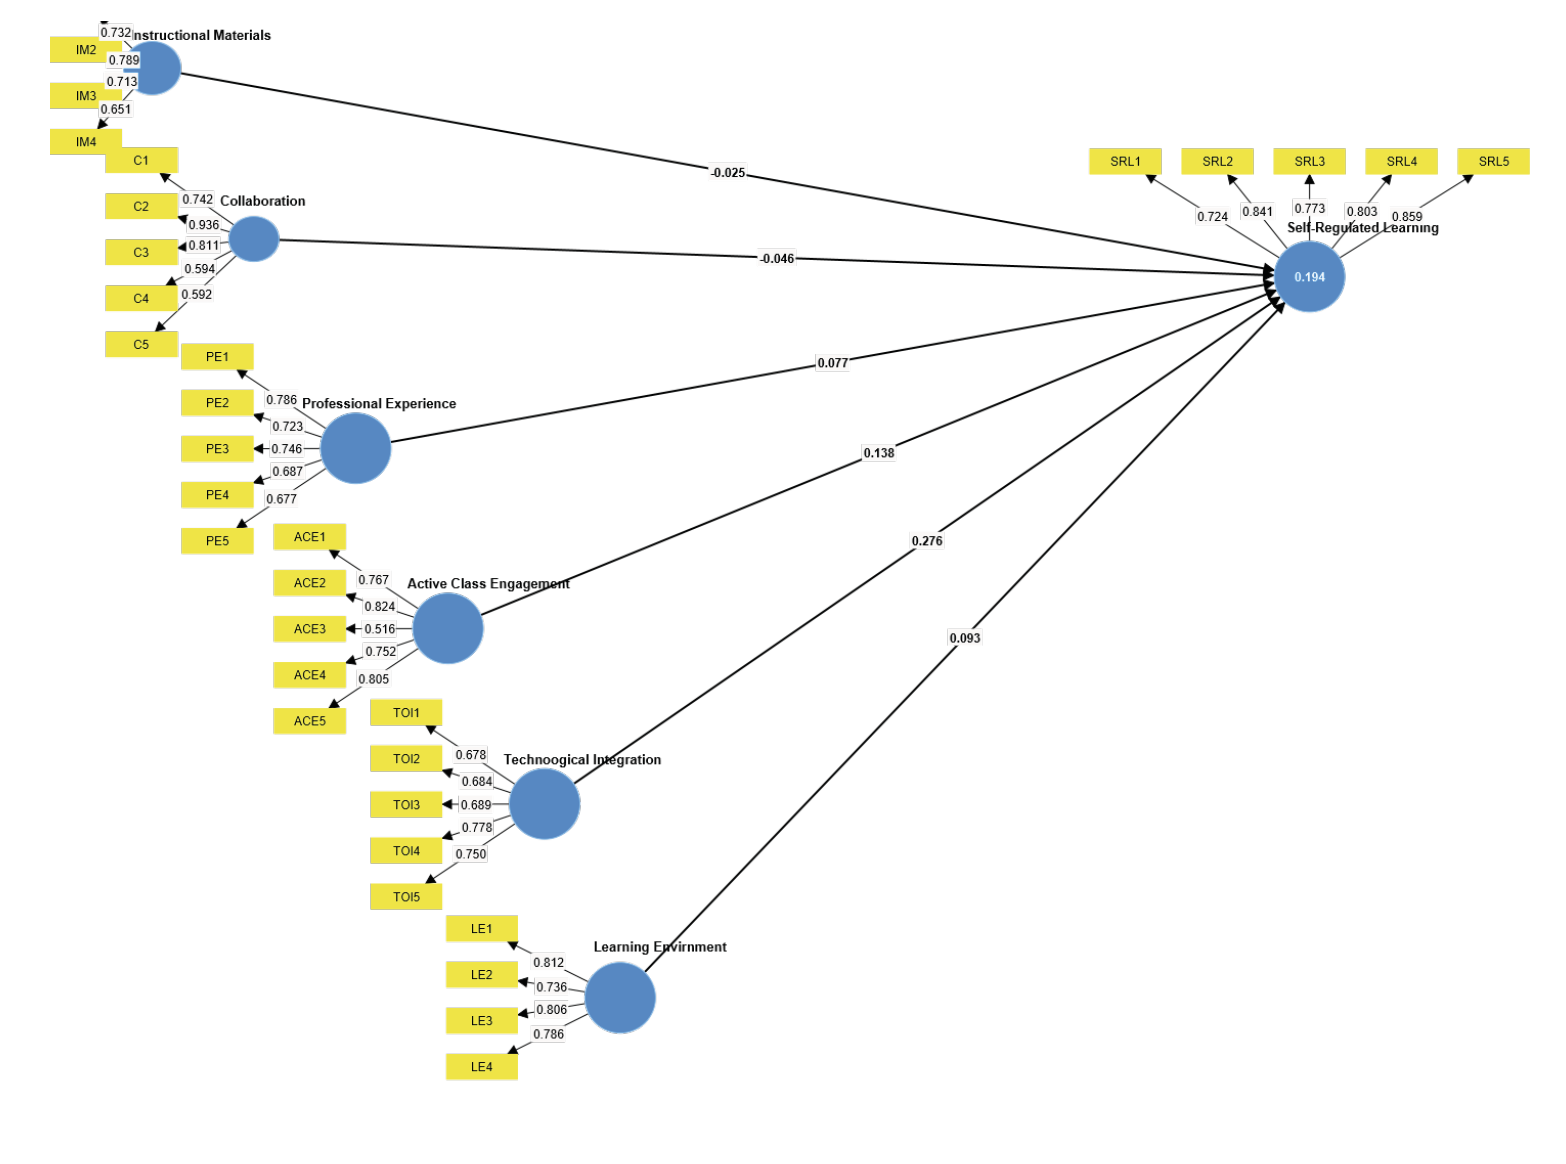
Figura 1 - Measurement Model.
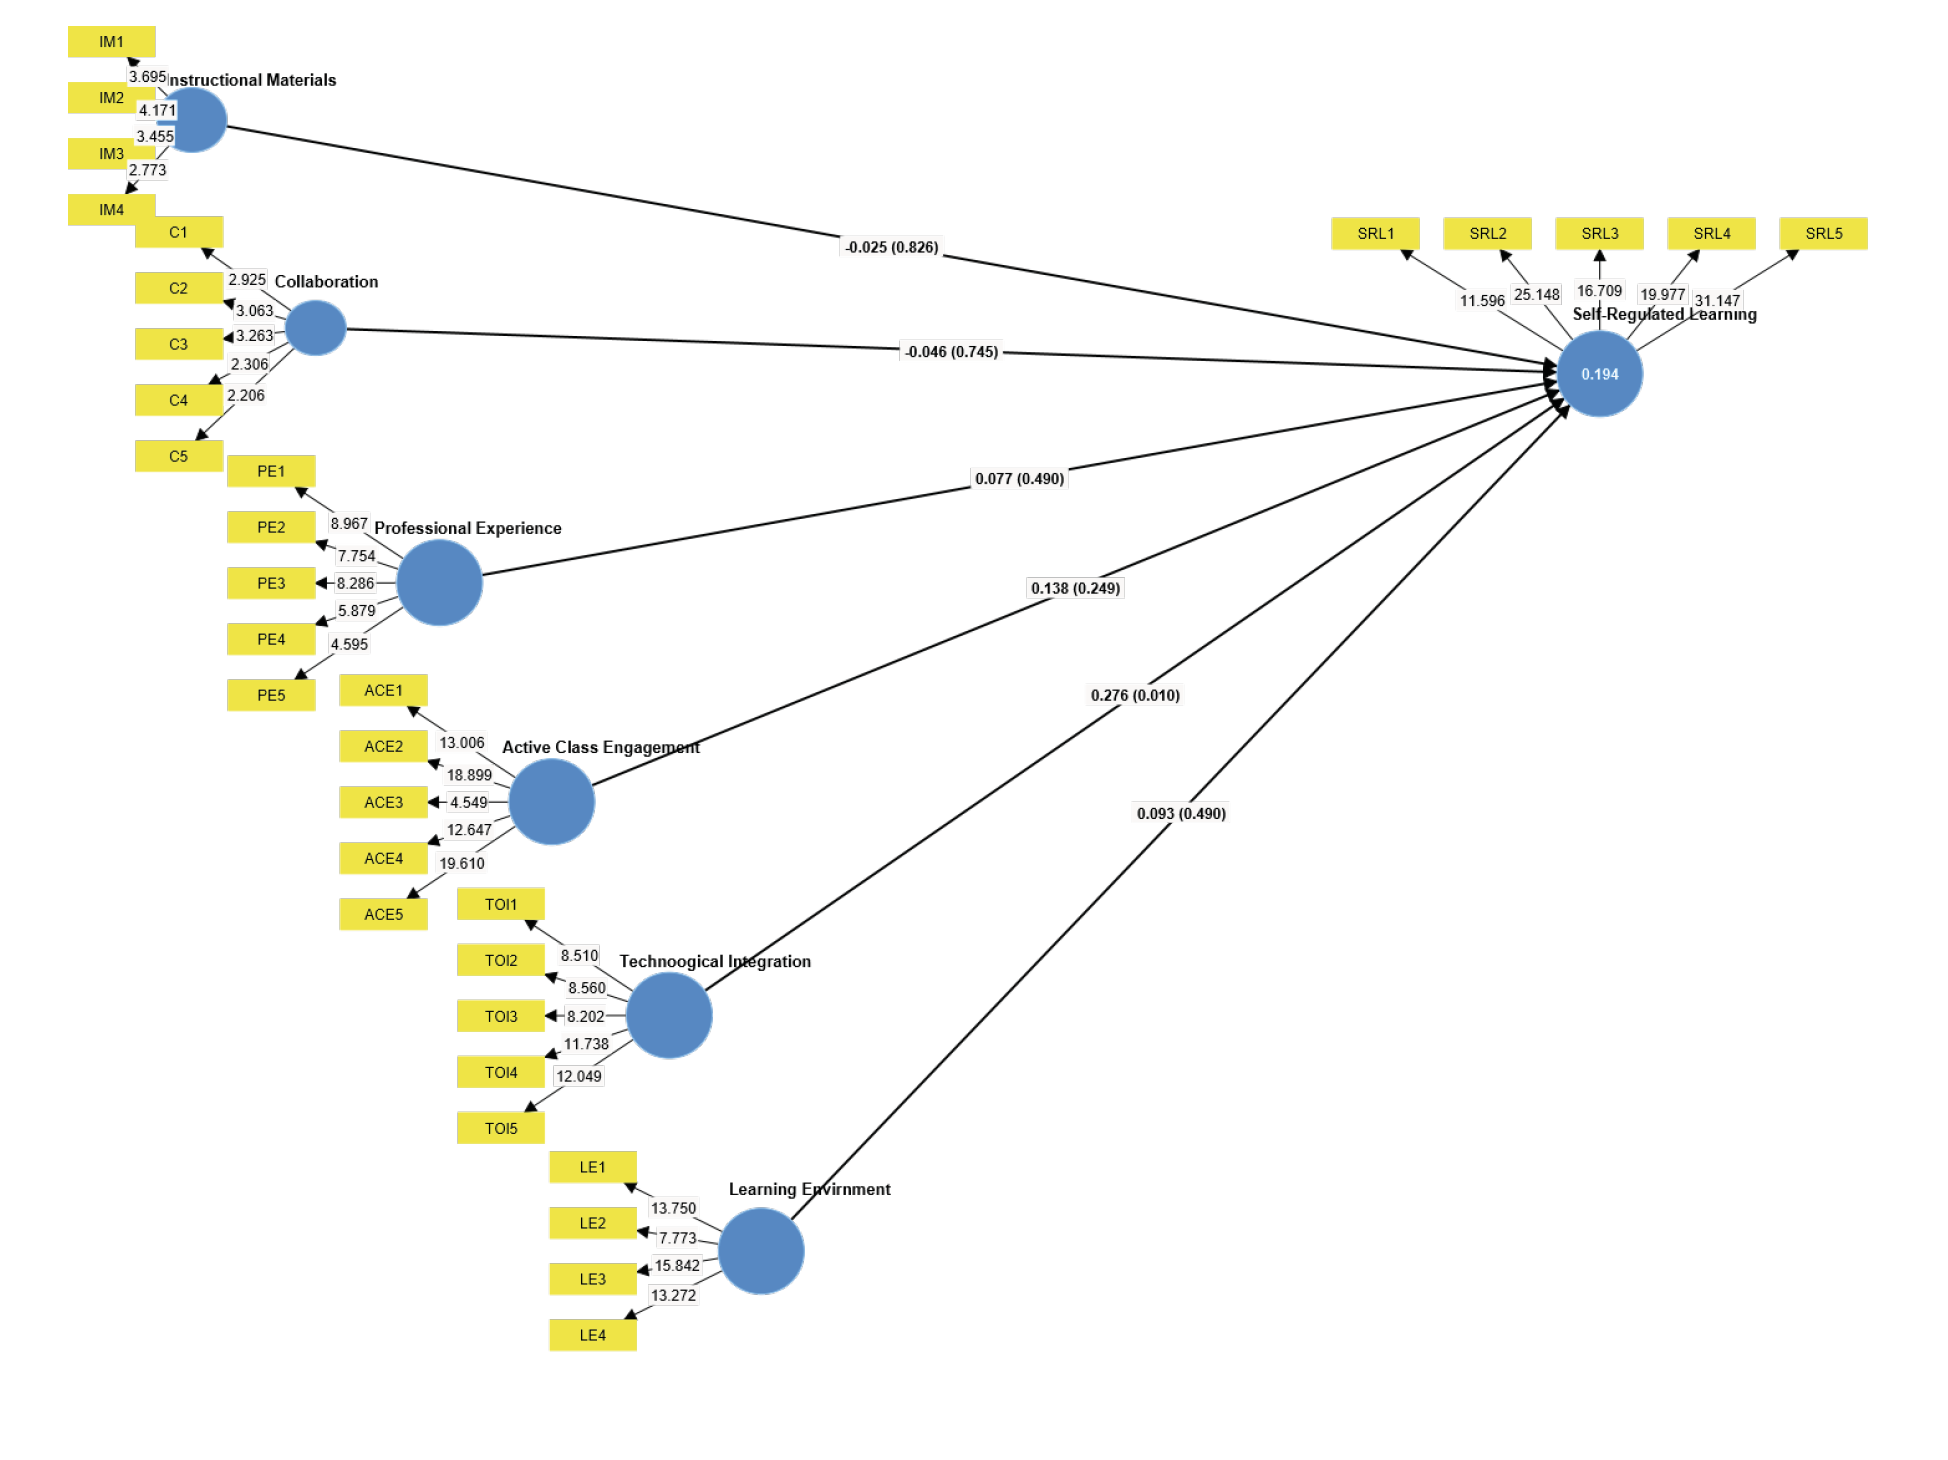
Figura 2 - Structural Model.